In this post I want to take address a secular change in the economy. One of the questions that frequently gets asked in any discussions about how the economy can recover is, "Where is the spending going to come from?" While many households are strapped, the status of aggregate savings in society may surprise you. What I'm going to discuss is that -- over a multi-year period -- savings leads to spending, spending means growth, and growth means jobs.
The BEA in its monthly personal income and spending report, also keeps track of savings and the saving rate. I want to show you that in real, inflation-adjusted terms. But since I can't make the transformation in the line itself (because one is measured quarterly, the other monthly), what I have done is to show it by comparing the amount of savings (blue) with the change in prices due to inflation, measured at the high (red) and low (green) points compared with those savings:
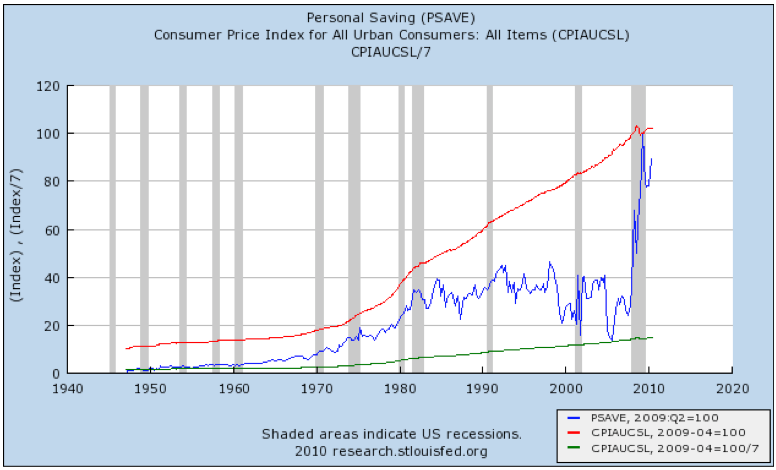
As you can see, after reaching a post World War 2 inflation adjusted low in 2005, in the last 5 years personal savings have skyrocketed to its postwar high at the bottom of the recession in the second quarter of last year. Simply put, there is an awful lot of "fuel" available to fire up spending.
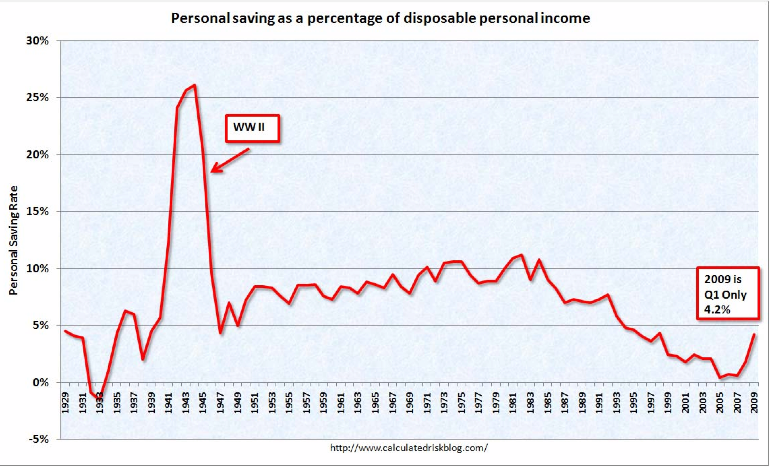
But the above series only goes back to 1947. What about during the Great Depression? Using a slightly different series -- the personal savings *rate* as a percentage of disposable personal income, Prof. James Kennedy was able to generate this data, and as recently as the 1st quarter of 2009, Calculated Risk plotted it on the following graph:
With the release of second quarter GDP, CR updated a more truncated graph of the same information:
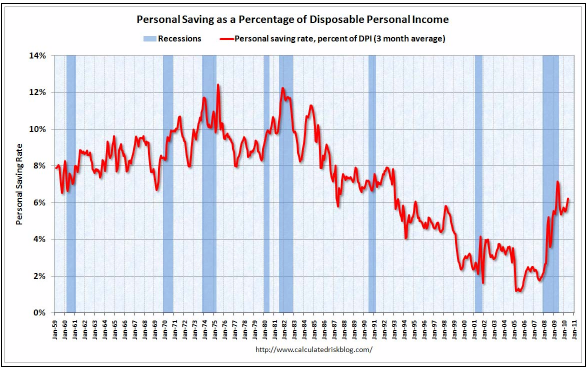
Note that the trend in the personal savings rate during the Great Depression and "Great Recession" in the two graphs above are nearly identical.
The graphs also tell us that the 1930-32 period was much more severe than the last few years, as even in the aggregate families went through accumulated savings during the worst of the downturn. In our era, savings were blown on toys via home equity withdrawals earlier in the decade, and throughout the downturn there was a dramatic increase in savings, almost identical to what happened during the New Deal recovery from the Great Depression bottom.
But what can accumulated savings, and a dramatic increase in the savings rate, tell us about spending, growth, and jobs?
The most informative way to look at the issue is to measure "real" savings, that is, the percentage by which savings exceed inflation. And here, the story is equally dramatic. At the bottom of the "Great Recession" a year ago, the "real savings rate" was higher than at any point since World War 2.
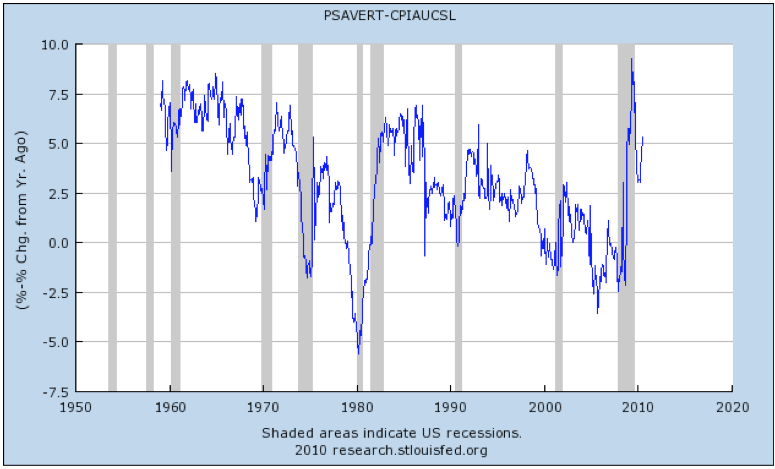
Indeed, since we know that the savings rate was something like 6% during the New Deal era, at which time inflation averaged 2.5%, last year we had even higher savings than then (note that during World War 2, saving almost literally went "off the chart.").
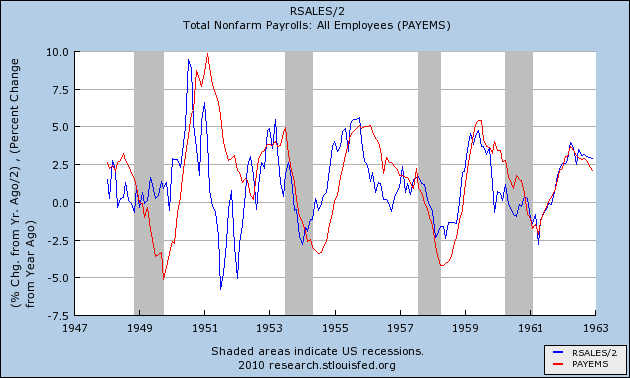
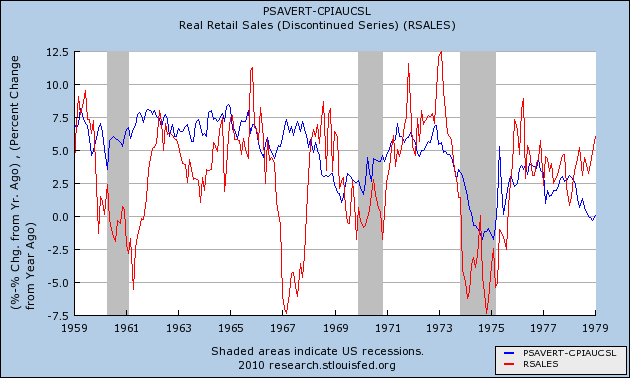
In the past, I've shown that real retail sales is a reliable leading indicator of job growth and losses. Here are a couple of those graphs, first for the immediate post World War 2 period:
Note that the trend in the personal savings rate during the Great Depression and "Great Recession" in the two graphs above are nearly identical.
The graphs also tell us that the 1930-32 period was much more severe than the last few years, as even in the aggregate families went through accumulated savings during the worst of the downturn. In our era, savings were blown on toys via home equity withdrawals earlier in the decade, and throughout the downturn there was a dramatic increase in savings, almost identical to what happened during the New Deal recovery from the Great Depression bottom.
But what can accumulated savings, and a dramatic increase in the savings rate, tell us about spending, growth, and jobs?
The most informative way to look at the issue is to measure "real" savings, that is, the percentage by which savings exceed inflation. And here, the story is equally dramatic. At the bottom of the "Great Recession" a year ago, the "real savings rate" was higher than at any point since World War 2.
Indeed, since we know that the savings rate was something like 6% during the New Deal era, at which time inflation averaged 2.5%, last year we had even higher savings than then (note that during World War 2, saving almost literally went "off the chart.").
In the past, I've shown that real retail sales is a reliable leading indicator of job growth and losses. Here are a couple of those graphs, first for the immediate post World War 2 period:
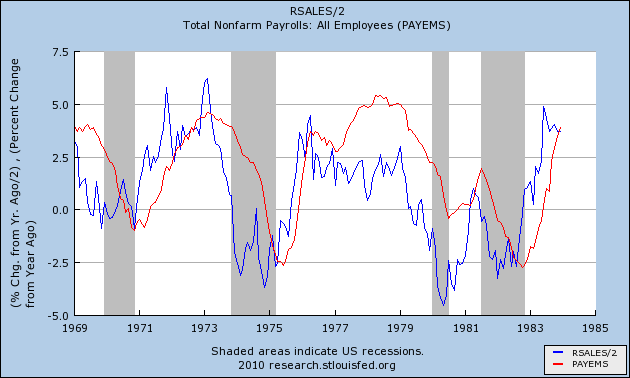
And here it is for the 1970s recessions and recoveries:
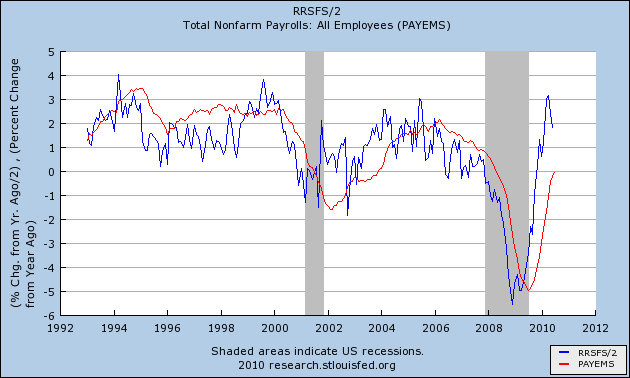
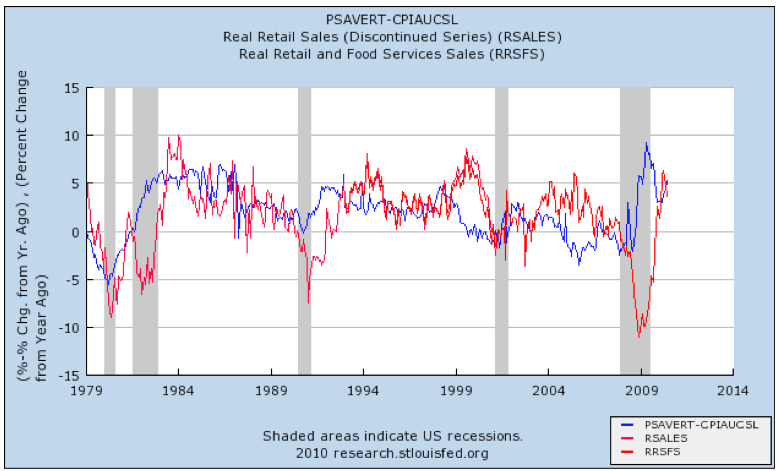
Finally, here is the same series measured YoY, including last Friday's data. As you can see, despite the disappointing jobs figures of the last couple of months, the relationship is still holding solidly:
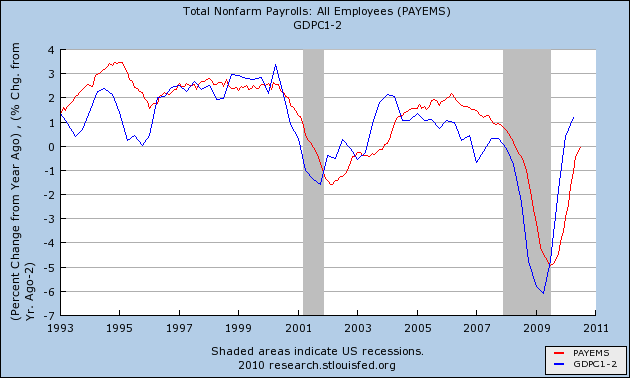
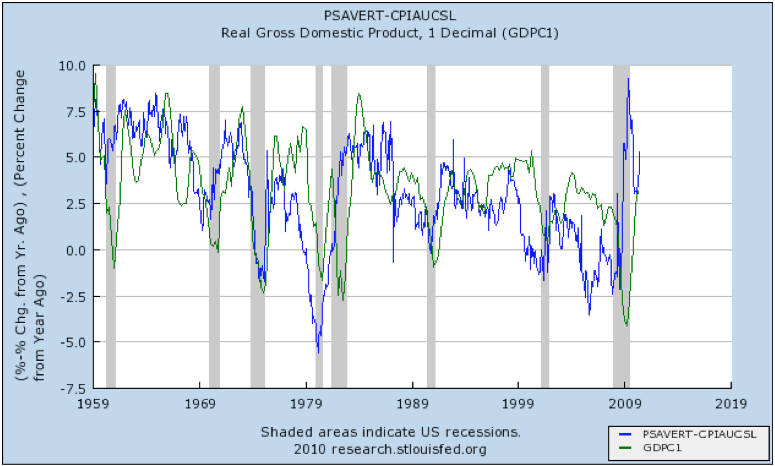
Since consumer spending is about 2/3's of GDP, the same relationship holds between GDP growth and subsequent job growth, where YoY growth of GDP somewhere north of 2% has been consistent with actual job growth:
All we need to do now is connect the "fuel" (savings) to the "fire" (spending). Here are several graphs showing the relationship for the last 50 years between the "real savings rate" (blue) and "real retail sales" (red):
Although the comparison is somewhat noisy, with several exceptions (spending crashing compared with saving as the Fed raised interest rates in 1966, again when Volcker raised interest rates 10% in 1981, and finally spending soaring with saving crashing during the "housing only goes up!" mortgage equity withdrawal mania of 5 years ago), real saving has been a reliable leading indicator of consumer spending. In short, when the real savings rate goes up dramatically, it brings on a recession. As consumers let go of some of their accumulated savings, and the savings rate levels off or declines, the spending brings about a consumer driven economic expansion.
It is clear that real personal savings also leads GDP growth.
Even if that does not occur, and we have a "double-dip", in the longer term, a continued increased rate of savings will fuel an even more robust recovery once housing prices bottom in a couple of years or so.
Similarly, here is the "real personal savings rate" compared with GDP:
It is clear that real personal savings also leads GDP growth.
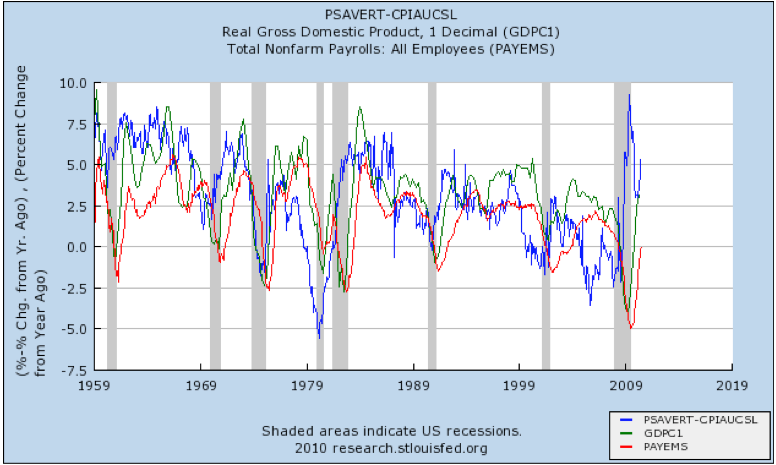
In other words, accumulated savings eventually gives way to spending. That spending leads to growth, and then that growth leads to the creation of jobs. Here is a rather noisy graphs encompassing all of those data series:
But to simplify, let's cut out the middle-in-time series. Here is a graph of the real savings rate (blue) and job growth (red):
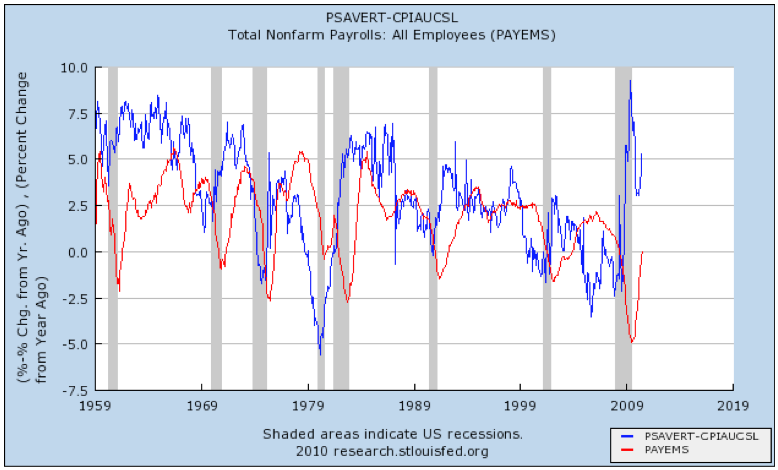
An increase in savings is a "long leading indicator" -- frequently several years later -- of job growth. It is the fuel accumulated during recessions that leads to the fire of growth and jobs in the subsequent expansion.
In the second quarter, note that saving went back up again, as people were scared by a number of things (in particular that the Eurozone crisis) into believing the credit markets might freeze up again (see Bonddad's post yesterday on LIBOR rates). Concurrently, retail spending stalled, going down -0.7% in May and -0.4% in June.
IF the stressors that gave rise to increased savings and decreased spending in the second quarter abate (as is suggested by, e.g., the decrease in the Libor rates in the last few weeks), the above indicates that there is plenty of "fuel" still stored up to reinvigorate consumer spending, that should in turn create more private sector jobs. That growth may be enough to counter the loss of state and local government jobs (which if estimates are accurate may continue to run 20,000 a month) and a renewed loss of some construction jobs (on the order of 5,000 to 10,000 a month) due to the downturn in housing after the expiration of the $8000 housing credit, even in the absence of further fiscal stimulus.
But to simplify, let's cut out the middle-in-time series. Here is a graph of the real savings rate (blue) and job growth (red):
An increase in savings is a "long leading indicator" -- frequently several years later -- of job growth. It is the fuel accumulated during recessions that leads to the fire of growth and jobs in the subsequent expansion.
In the second quarter, note that saving went back up again, as people were scared by a number of things (in particular that the Eurozone crisis) into believing the credit markets might freeze up again (see Bonddad's post yesterday on LIBOR rates). Concurrently, retail spending stalled, going down -0.7% in May and -0.4% in June.
IF the stressors that gave rise to increased savings and decreased spending in the second quarter abate (as is suggested by, e.g., the decrease in the Libor rates in the last few weeks), the above indicates that there is plenty of "fuel" still stored up to reinvigorate consumer spending, that should in turn create more private sector jobs. That growth may be enough to counter the loss of state and local government jobs (which if estimates are accurate may continue to run 20,000 a month) and a renewed loss of some construction jobs (on the order of 5,000 to 10,000 a month) due to the downturn in housing after the expiration of the $8000 housing credit, even in the absence of further fiscal stimulus.
Even if that does not occur, and we have a "double-dip", in the longer term, a continued increased rate of savings will fuel an even more robust recovery once housing prices bottom in a couple of years or so.