- by New Deal democrat
The effect of miserably inadequate wage increases compared with corporate profits is the most potent case for economic pessimism. If people don't have the money, they can't buy your stuff!
In his most recent appearances, ECRI's spokesman emphasized this negative, as have many other bears. While it's a legitimate concern, in my opinion all of the bears are overlooking the very powerful effect that refinancing mortgages at lower interest rates has on disposable income.
As an initial matter, I continue to have problems with ECRI's sudden focus on YoY comparisons of seasonally adjusted data. The rationale is that the 2008-09 recession distorted those adjustments. Even if that is true, it misses the lion's share of the issue with real personal income.
First off, here's the graph of real personal income since 1999, measured as a YoY%:
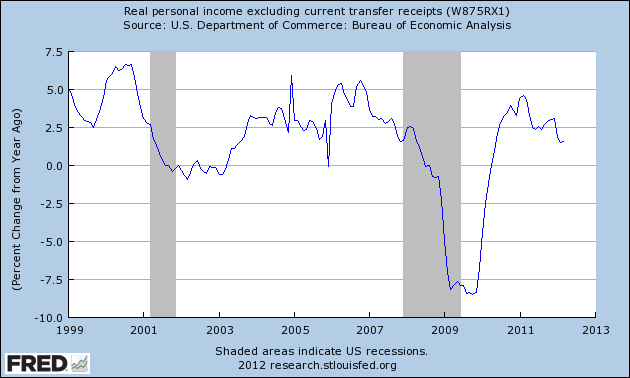
It has suddenly declined in the last 3 months to a level equivalent to entering the last two recessions. WE"RE DOOMED!
Not so fast. Remember the Social Security tax rebate that started in January 2011? It had a profound effect on personal income, as indicated in this bar chart of monthly changes:
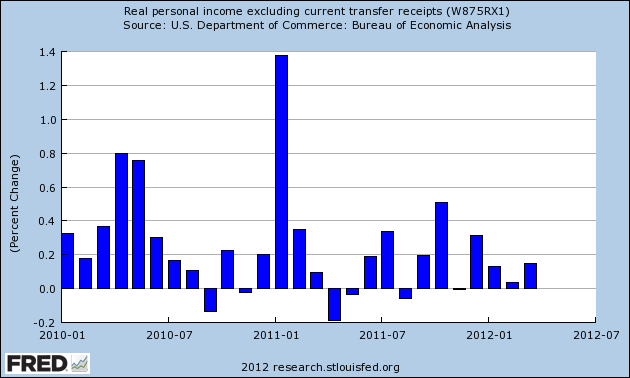
A +1.4% change in real personal income is going to have a big effect on YoY comparisons, that will end exactly 12 months later. And so it did, as shown in this next graph in which the effects of the Social Security tax rebate are deleted, in red:
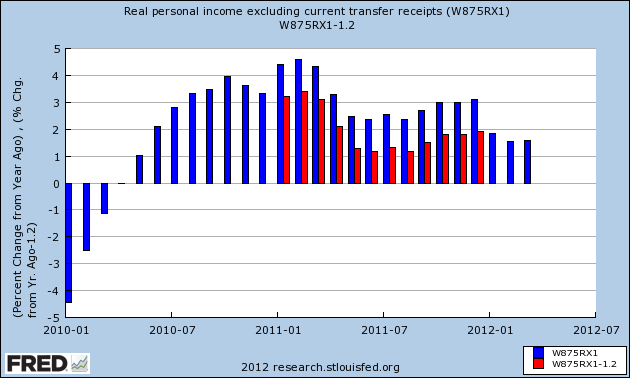
When we strip out the effects of that rebate, the decline in growth of real personal income occurs in midyear 2011 rather than beginning in 2012. That doesn't mean that the rebate didn't have an effect. Consumers filled up their gas tanks with it, as it almost exactly offset the big increase in gas prices in the first half of 2011. But that is hardly a seasonality issue. So, if increases in real income have stunk so bad for nearly a year, why didn't we move into recession by the end of last year?
Let's look at a graph of actual income since 1999. This looks more positive, doesn't it?
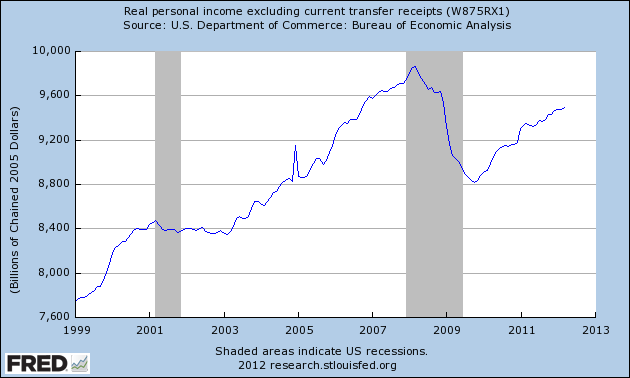
Note that in contrast to its continuing increase now, real income was flat to slightly declining all the way through 2002 and the first part of 2003. During this same period, as in 2011, the economy was muddling through at about 2% or less annualized GDP. So why didn't we have a double-dip then?
The answer takes us directly to the effects of refinancing. Below are three graphs I have run before, and can't be emphasized enough.
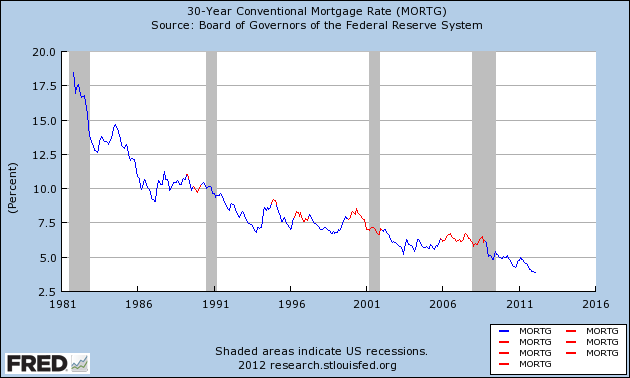
First of all, here are mortgage rates since their peak over 30 years ago. So long as households could refinance at lower rates, no recession has occurred (blue). Once the tap was shut off by no move lower in rates for at least 3 years, recessions ensued (red):
In the next graph, from Mortgage News Daily, you can see how refinancing had slowed to a trickle through almost all of 2007 and the first eight months of 2008:

Refinancing has come back with a vengeance since then, and continues right up until the present.
As a result, household debt a a percentage of disposable personal income continues to decline rapidly:

The Federal Reserve releases this info at the end of the ensuing quarter, so the last data available was released in March covering the 4th quarter of last year. In a month we'll find out what happened in the first three months of this year, and there is every reason to believe that household debt as a percent of disposable income as I write this post has already declined to 30 year lows.
So long as the ability to lower the carrying cost of household debt continues, I do not think the low positive growth in real personal income signals recession.