The theory was originally developed by Irving Fisher. The entire theory can be read here. In addition, Fisher wrote a very good economic textbook which you can purchase for Kindle here.
Here is the key paragraph from the debt deflation theory, which outlines a series of events that cause debt deflation:

Fisher developed this theory to explain the Great Depression. Additionally, the above chain of events provides an excellent explanation of the bursting of the housing bubble and its long-term ramifications. First, let's walk through the basic chain of events of the 2000s.
1.) People start to borrow a ton of money to buy things. Here's a chart of total mortgage debt outstanding in log scale format:

Simply eyeballing the chart, we see total mortgage debt of about $10.5 trillion being the peak. Also note the acceleration in debt accumulation during the housing bubble; total mortgage debt stood at about $5.5 trillion after the early 2000s recession and nearly doubled over a 6-7 year period.
Another way to look at the above number is the relationship of mortgage debt to real disposable income:

The above chart shows that total mortgage debt to real DPI was slightly over 1 at the height of the bubble, indicating that consumers were heavily indebted -- and that's before we add in credit card debt etc...
Now -- as prices for the asset purchased with all of this debt start to fall (or, put another way, the mania starts to fall), we start to see panic selling:

Note that selling in the housing market started to show-up in the Case Shiller index a little before 2008. This contributed to:
An overall decrease in monetary velocity.
Put another way, we get the following: Before the bubble bursts, we see euphoric buying as everybody and their brother participates in the mania. When the bubble starts to burst, everybody starts to sell, but there are few buyers; hence, prices drop. This drop in activity leads to a slowdown in velocity, indicating more hoarding of cash.
After this cycle starts, it starts to spread to the economy as a whole. Businesses net worth takes a bit, leading to a drop in profits and a drop in output. Let's take a look at this data:


The above charts highlight the overall trend outlined by Fisher. Net worth drops, leading to a drop in profits and an overall drop in industrial production.
The above chain of events lead to a drop in confidence:

So, we see the basic chain played out in the actual data.
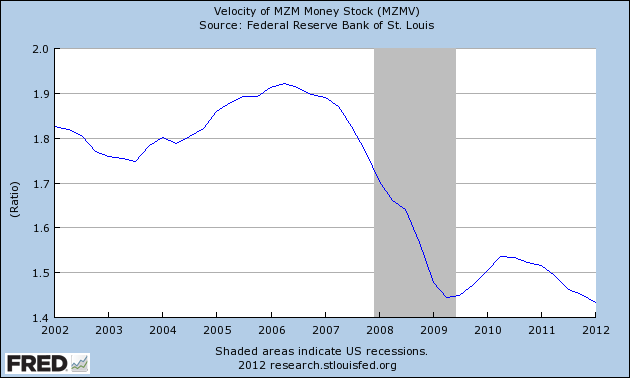
The logical counter-argument to the above series of events is that corporate balance sheets have recovered; net worth has risen as have profits. Therefore, the cycle is over. This is an incorrect conclusion, largely because of the continued low reading of velocity:


The above charts show the velocity for M1, M2 and MZM. It's important to understand what this measures; velocity is
The speed with which MONEY whizzes around the economy, or, put another way, the number of times it changes hands. Technically, it is measured as GNP divided by the MONEY SUPPLY (pick your own definition). It is an important ingredient of the QUANTITY THEORY OF MONEY.Put in less formal terms, lower velocity means more people are hoarding money. So, when they get paid, they spend less. While some of this is good as it indicates that people are saving more, it also means that people are scared -- hence the continued low confidence reading. Remember that an economy needs motion -- people buying things. And that is the central problem we face right now.
When this series of events is compared tot he Reagan recovery of the 1980s, the clear distinctions become apparent; Reagan's recovery was caused by the Fed raising rates and strangling inflation. There was no buying mania of any commodity or good prior to the recession; hence the long-term effects of a bursting bubble had nothing to do with the 1980s -- and, in fact, the absence thereof is a reason for the fast pace of recovery after that recession.
In contrast, this recovery is still mired in high debt readings, low consumer confidence and low velocity, indicating we're nowhere near healed.