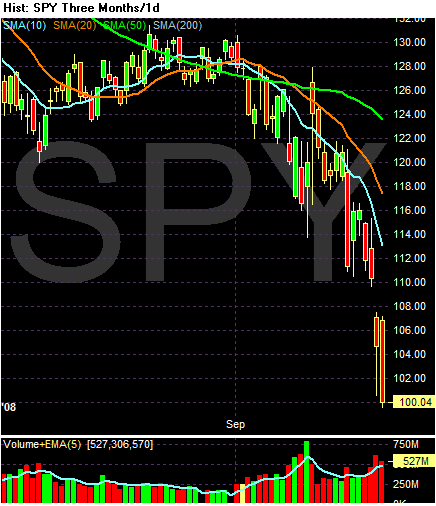
On the SPYs, notice the following:
-- Prices are below the 200 day SMA
-- All the SMAs are moving lower
-- The shorter SMAs are below the longer SMAs
-- Prices are below all the SMAs
-- The SPYs have lost approximately 22% since the beginning of September
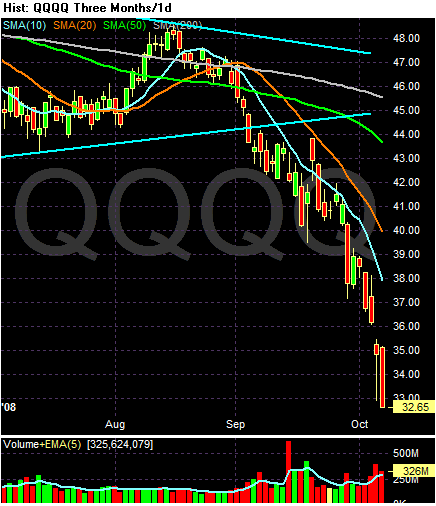
-- Prices are below the 200 day SMA
-- All the SMAs are moving lower
-- The shorter SMAs are below the longer SMAs
-- Prices are below all the SMAs
-- The QQQQ s have lost approximately 32% since the beginning of September
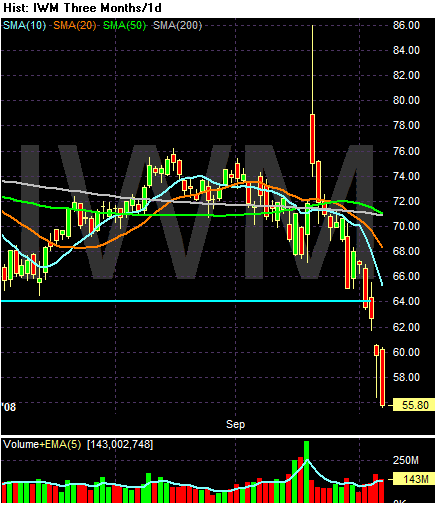
The SMA picture for the IWMS has been somewhat cloudy for the last few days, but a clear picture is starting to emerge. And it isn't good.
-- Prices are below the 200 day SMA
-- The shorter SMAs are all moving lower
-- The 50 day SMA is about to move below the 200 day SMA
-- Prices are below all the SMAs