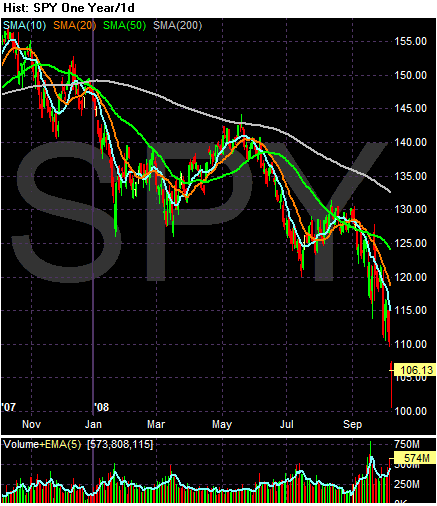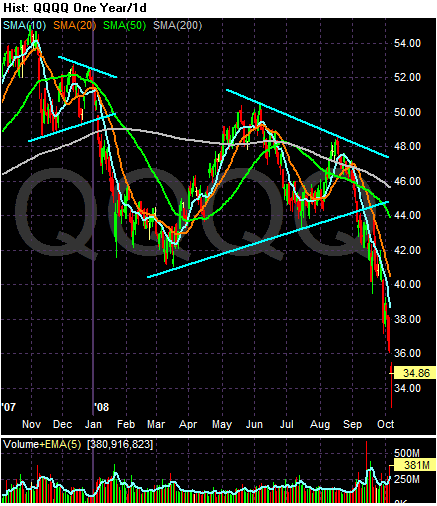
On the SPY's note the following:
-- Prices are below all the SMAs
-- All the SMAs are moving lower
-- The shorter SMAs are below the longer SMAs
-- Prices are below the 200 day SMA

-- Prices are below all the SMAs
-- All the SMAs are moving lower
-- The shorter SMAs are below the longer SMAs
-- Prices are below the 200 day SMA

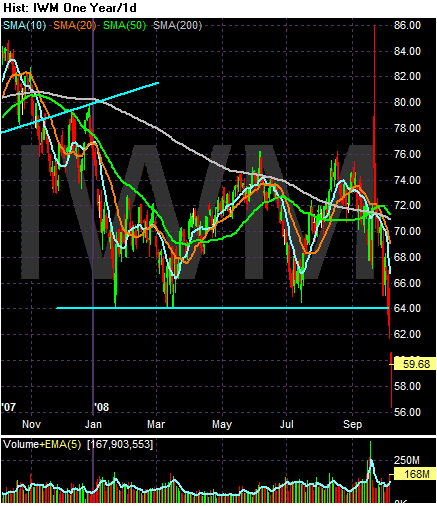
On the IWMs, note that prices finally broke through the 64 level.
With all of the above charts note that prices gapped down today on high volume.
While I would expect a relief rally over the next few days, this is a terrible way to start the week.