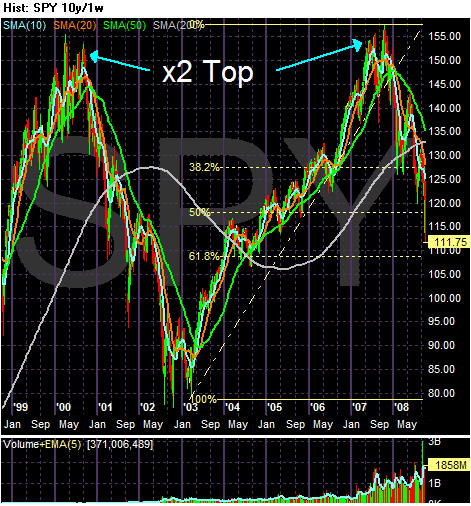
On the 10 year chart notice the following:
-- The SPYs have clearly formed a multi-year double top. This corresponds to the end of the internet bubble in 2000 and the end of the housing bubble last year.
-- Also note the latest sell-off is not approaching the 61.8% Fibonacci retracement level. That means we have at least a point and a half more to go, assuming the market is targeting Fib levels.
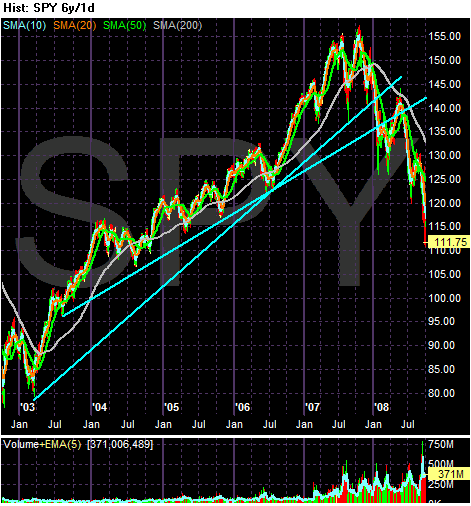
Regardless of the trend line you use, the SPYs have clearly broken the upward sloping trend line supporting the market for the last 5+ years.
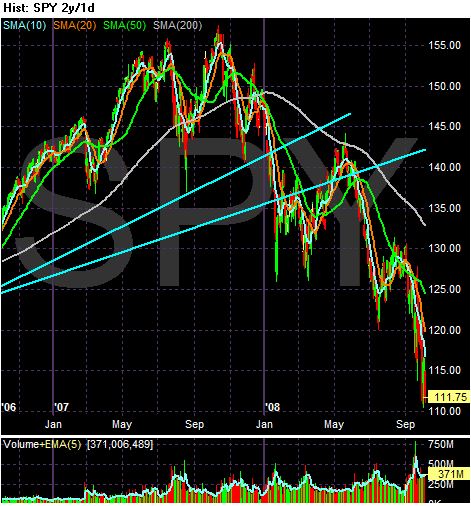
On the 1 year chart, notice the SPYs are in a clear pattern of lower lows and lower highs. This is a classic bear market formation. Also note:
-- The market has lost almost 30% since its high in October of last year
-- Prices are below the 200 day SMA by almost 16%
-- All the SMAs are moving lower
-- The lower SMAs are below the longer SMAs
-- Prices are below the longer SMAs
Bottom line: this is a bearish chart, plain and simple.
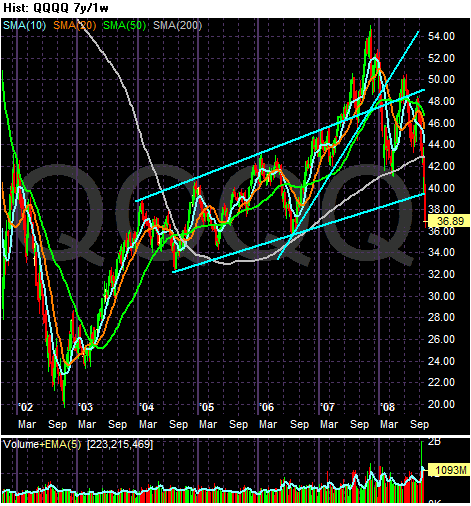
On the multi-year QQQQ chart, notice the current price level has broken all three important uptrends that supported the latest, multi-year rally. In other words, the rally is over.
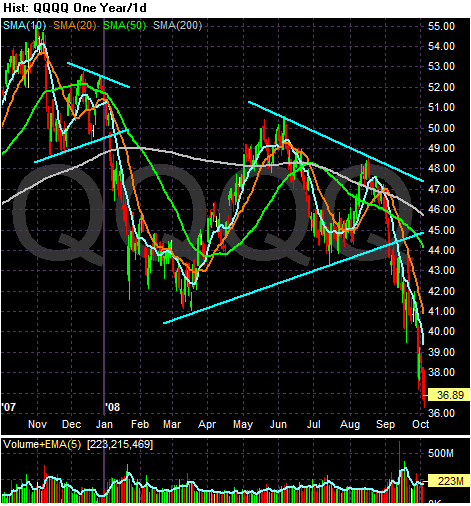
On the one year chart, notice that prices have consolidated in two triangle. The first lasted two months and occurred at the end of 2007. The second lasted for most of 2008 but prices broke through the lower support line at the beginning of September. Prices have fallen almost 32% from their high at the end of the summer in 2007. Finally, note that prices are at their lowest point of the last year.
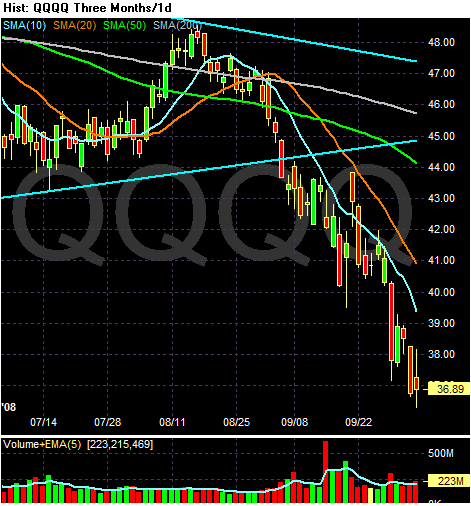
On the three month chart, notice the following:
-- Prices are 19% below the 200 day SMA
-- All the SMAs are headed lower
-- The shorter SMAs are below the longer SMAs
-- Prices are below all the SMAs
Bottom line: This is a bearish chart.
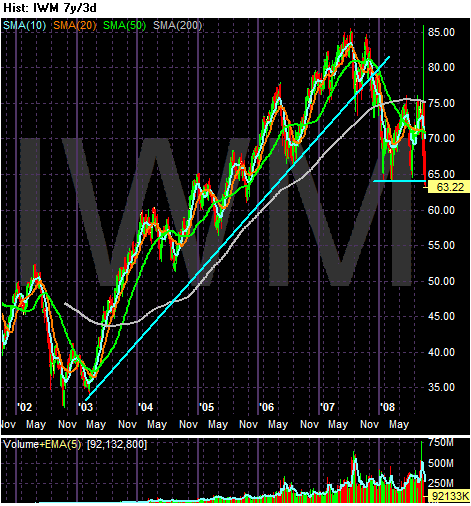
On the multi-year IWM chart, notice that prices have broken the uptrend the supporter the multi-year rally. Since breaking the rally, the IWMs have moved in a roughly 10 point range between 64 and 74 (with a few spikes up to 76).
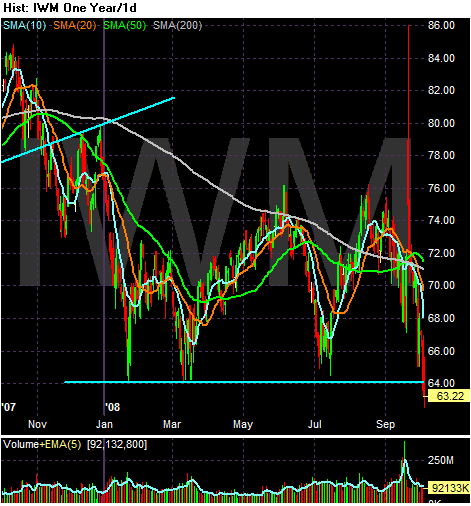
On the yearly chart we can better see the trading range that has occurred. 64 has provided incredibly important technical support.
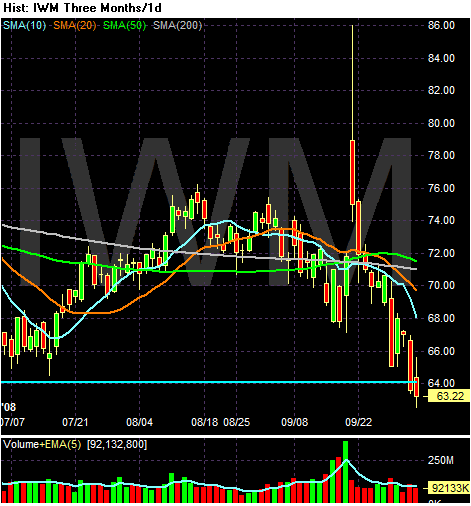
On the three month chart, notice the following:
-- Prices are below the 200 day SMA
BUT
-- All the SMAs are bunched up within a very narrow range. This indicates a lack of direction.
BUT
-- Prices have dropped below the key 64 level.
Bottom line: bearish when considered in line with the other charts.