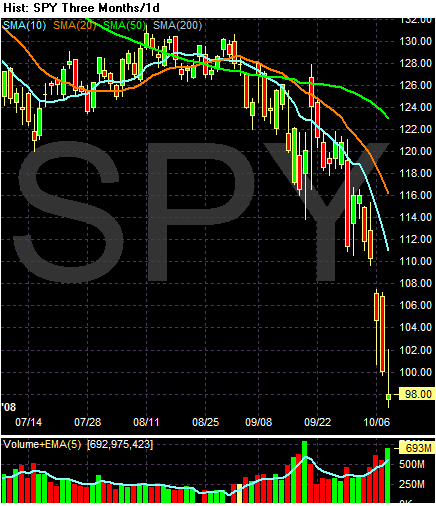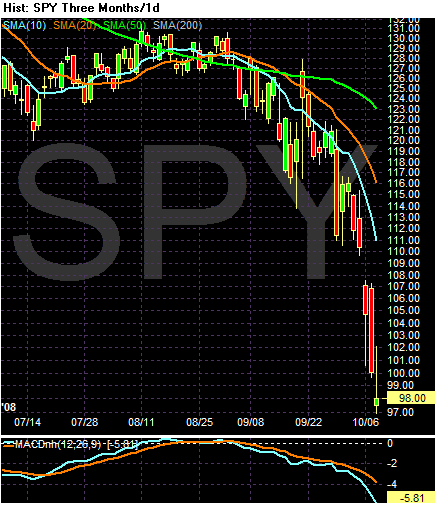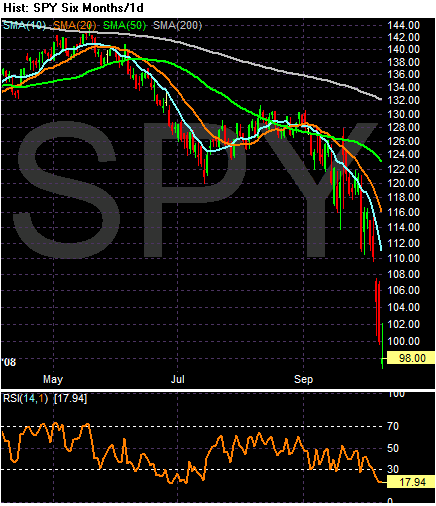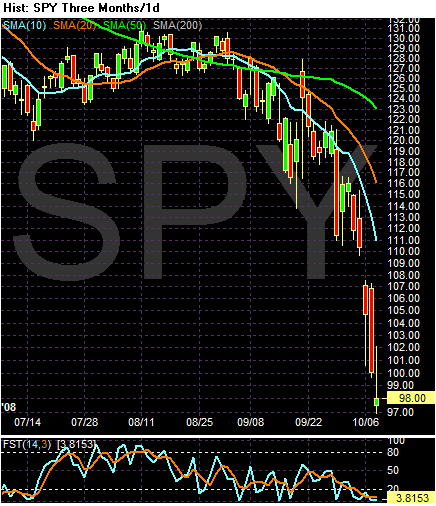
A look at the chart reveals a very bearish chart.
-- Prices are below all the SMAs
-- The shorter SMAs are below the longer SMAs
-- All the SMAs are moving lower
BUT, also note
-- Today was a high volume day, with a
-- The candle is an upside down hammer
However, by all technical indicators the market is extremely oversold right now.

The MACD is the lowest its been in three months, as is

The relative strength index.

Stochastics are also scraping the bottom.
In other words, don't be surprised to see a relief rally over the next few days.