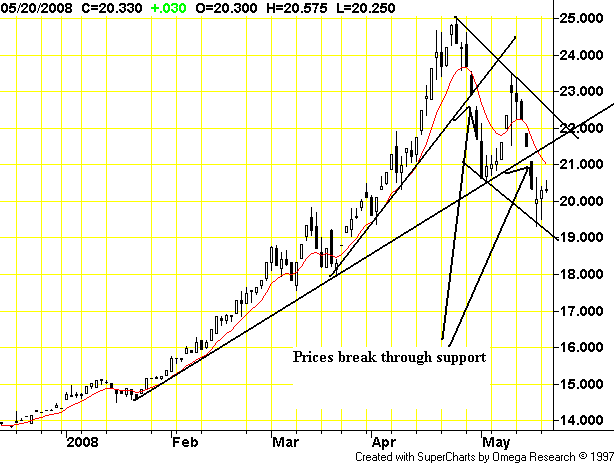
On rice's daily chart, notice that prices have clearly broken two different upward support trend lines. In addition, prices are clearly in a downward sloping trend channel
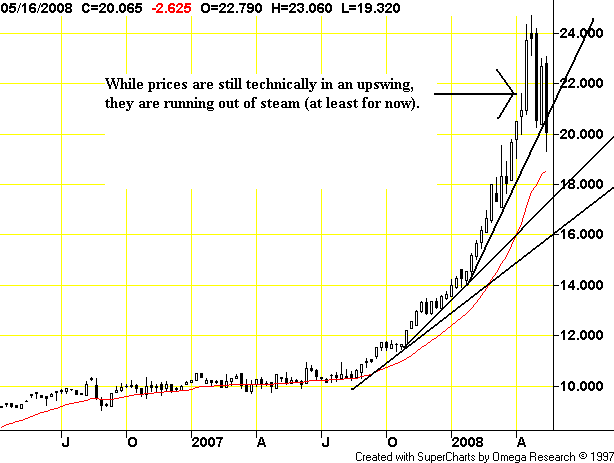
On rice's weekly chart, notice that while prices are still technically in an uptrend they are cooled. However, the weekly uptrends are still firmly in place. And while prices have technically dropped through support that could change by the end of the week. In other words, this could just as easily be a consolidation before a further move higher rather than lower.
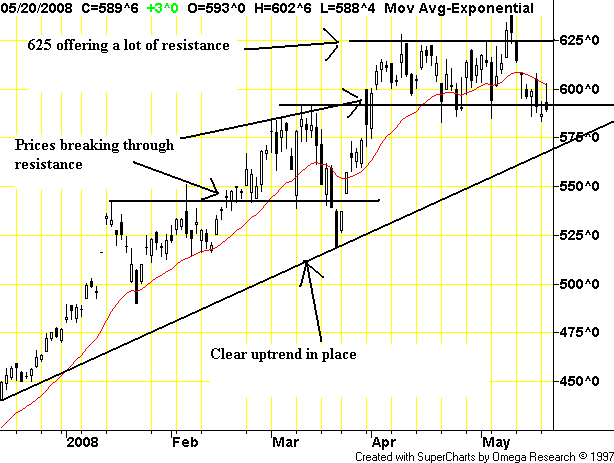
On corn's daily chart, notice tow important points.
-- There is still an uptrend in place, BUT
-- Prices are having a hard time getting over 625.
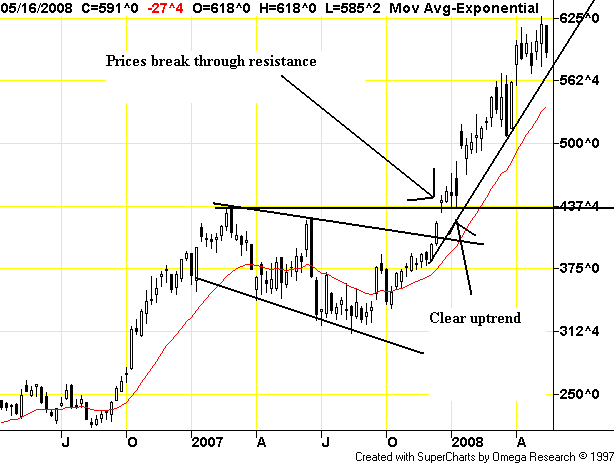
On corn's weekly chart, notice that prices are firmly in an uptrend.
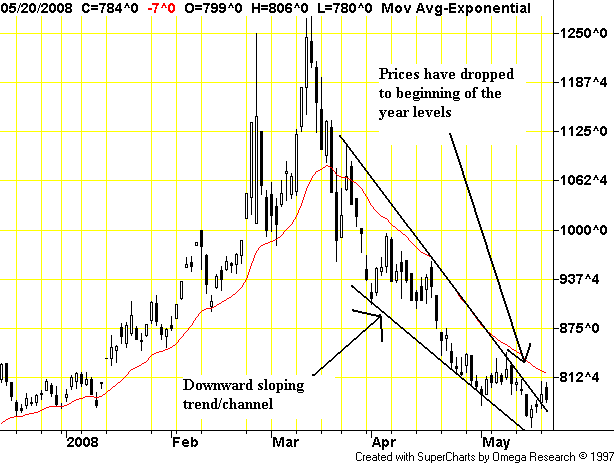
On wheat's daily chart, notice that prices have retreated to beginning of the year levels.
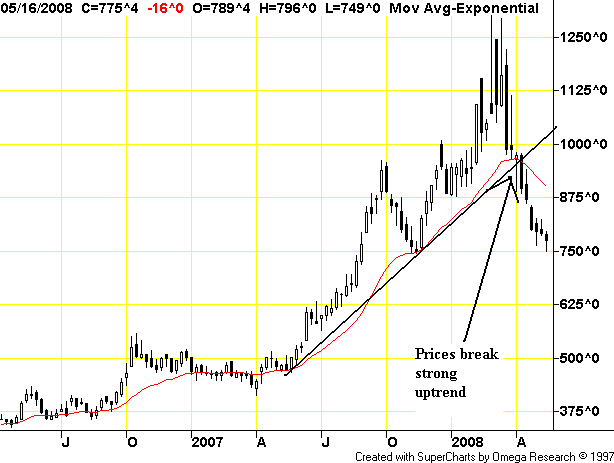
On wheat's weekly chart, note that prices have broken the uptrend started in mid-2007.