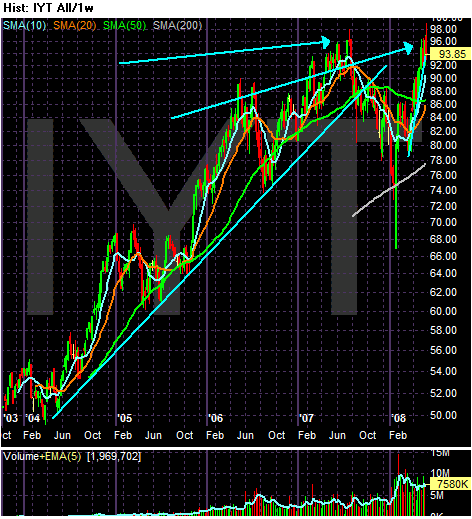
Let's start with this chart:

Each arrow is point to a possible top.
Now -- let's carry this out a bit further. Let's use Dow theory, which states the averages have to confirm each other. In other words, more than one sector of the economy has to be doing well in order for stocks to rise. So, if the economy is doing well, then transports have to rise as well.
The converse is also true -- areas of the market rise and fall with each other for various reasons.
So -- let's assume the transports are making a double top and will then drop. What does this mean for the other averages?

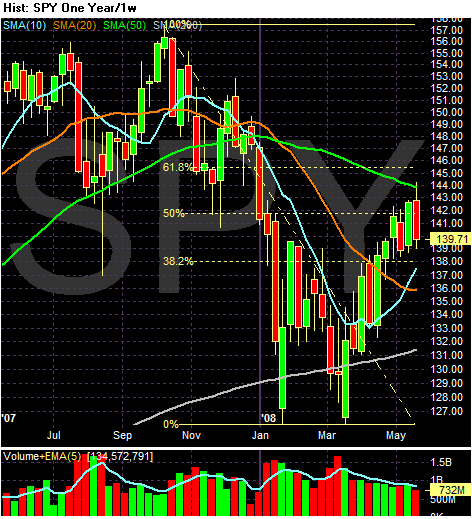
Note the SPYs have retraced about 50% of their drop from October of last year. That means the latest rally could be a solid bear market rally.

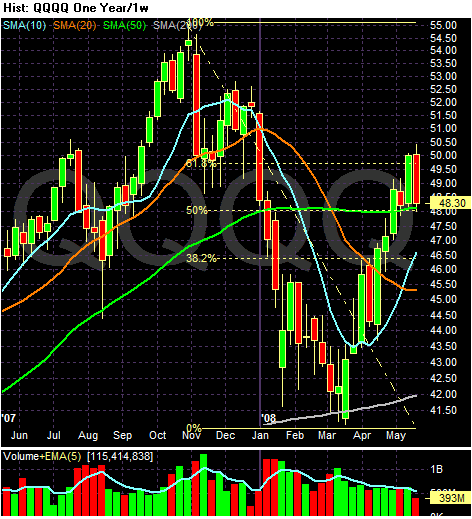
The QQQQs are at their 61.8% retracement level for another bear market rally.

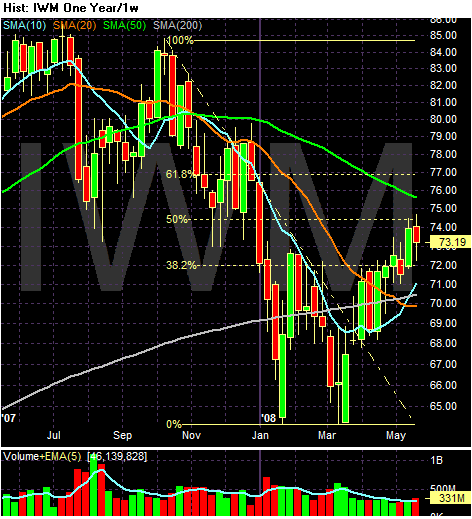
The IWMS are at the 50% retracement level.
So -- let's sum this theory up.
1.) The transports are currently forming a double top.
2.) All of the other averages are at technically important levels where traders would expect things to happen.
3.) The underlying economy is not doing that well -- at least according to the Federal Reserve:
The information reviewed at the April meeting, which included the advance data on the national income and product accounts for the first quarter, indicated that economic growth had remained weak so far this year. Labor market conditions had deteriorated further, and manufacturing activity was soft. Housing activity had continued its sharp descent, and business spending on both structures and equipment had turned down. Consumer spending had grown very slowly, and household sentiment had tumbled further. Core consumer price inflation had slowed in recent months, but overall inflation remained elevated.
In other words, the wind in the markets sails from the rate cuts and bear bail-out might be running into trouble from a badly damaged economy.