Federal energy officials expect oil to average $101 a barrel this year, a sharp upward revision from its earlier forecast that suggests prices will remain above $100 for some time.
But the U.S. Energy Information Administration expects American drivers, truckers and airlines to use less fuel this year as the economy softens. That could take some pressure off prices for gasoline and other fuels, and could keep the price of gasoline under a U.S. average of $4 a gallon.
Just months ago, $100-a-barrel oil seemed an aberration -- a price surge driven by speculators that would soon slip back to more reasonable levels. But the move by the agency -- usually a price bear that had predicted $87-a-barrel oil in January -- suggests $100 oil could be the new norm this year.The arm of the U.S. Energy Department also doesn't anticipate much relief next year, when it sees prices averaging $92.50 a barrel.
Crude oil for May delivery fell 59 cents a barrel, or 0.5%, to $108.50 Tuesday on the New York Mercantile Exchange. Oil hit a record high of $110.33 March 13.
Contrary to warnings from many analysts, the agency believes gasoline prices will remain below $4 a gallon in the U.S. during the height of the summer driving season. The government sees gasoline prices peaking in June at $3.60, up from the national average of around $3.33 now. The U.S., consumer of nearly a quarter of the world's daily crude production, is expected to use 85,000 barrels a day less this year in liquid fuels than in 2007, the agency said.
No one really knows where prices will end up -- despite their best intentions and good faith efforts to try and figure it out. However, here is the basic issue with energy demand: so long as India and China are still growing at strong clips, expect more upside price pressure. Those two countries add 2 billion people to the demand side of the equation.
Let's look at some charts.
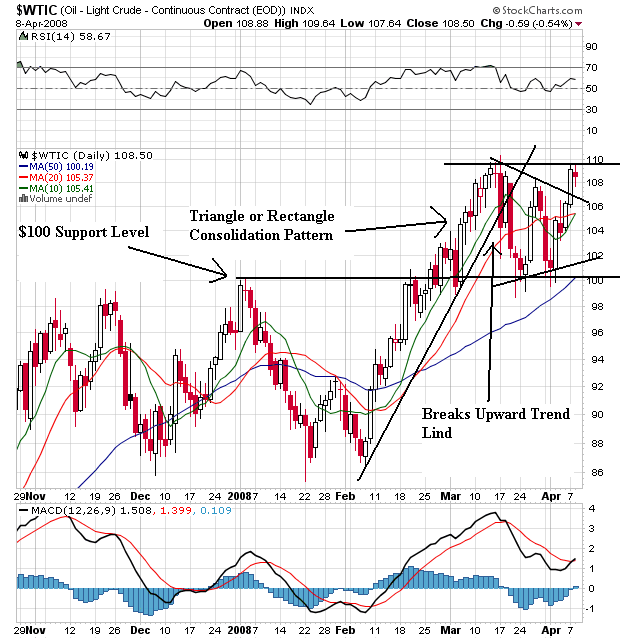
On the daily for oil, notice the following:
-- Prices were in an uptrend from early February to early March
-- Prices broke this trend, but have remained above the $100 level
-- Prices are consolidating above $100 level in either a triangle or rectangle formation
-- The 10 and 20 day SMAs are bunched together, indicating they are looking for direction.
-- Prices remain above the 50 SMA
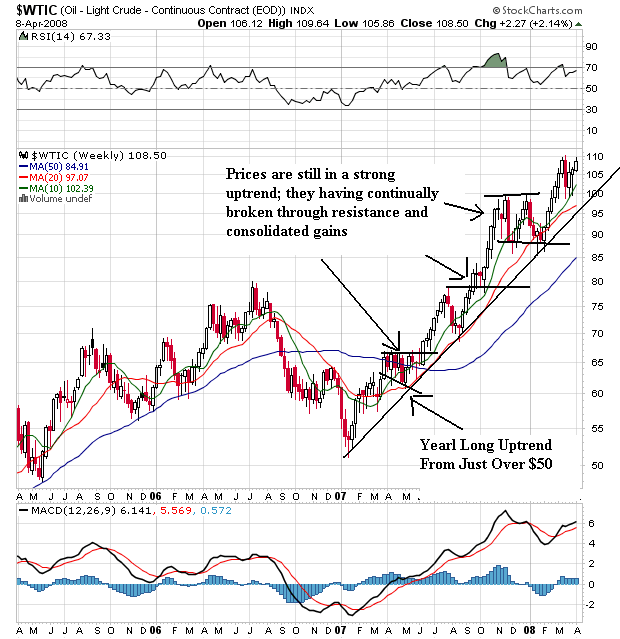
On oil's weekly chart, notice the following:
-- Oil started a rally at the beginning of last year.
-- Throughout the course of that rally, oil has moved through resistance and then consolidated price gains.
-- It has used the 10 and 20 week SMA as support
Short version: oil's charts are incredibly strong and show no sign of reversing.
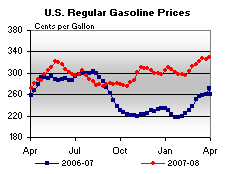
As a result, prices are the pump are noticeably higher.
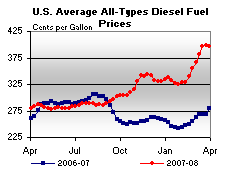
As a result of high fuel prices, we're starting to see protests from truckers:
Tons of freight idled across the country Tuesday as independent truckers pulled their rigs off the road while others slowed to a crawl on major highways in a loosely organized protest of high fuel prices.
Using CB radios and trucking Web sites, some truckers called for a strike Tuesday to protest the high cost of diesel fuel, hoping the action might pressure President Bush to stabilize prices by using the nation's oil reserves.
"The gas prices are too high," said Lamont Newberne, a trucker from Wilmington, N.C., who along with 200 drivers protested at a New Jersey Turnpike service area. "We don't make enough money to pay our bills and take care of our family."
On the Turnpike, southbound rigs "as far as the eye can see" staged a short lunchtime protest by moving about 20 mph near Newark, jamming traffic on one of the nation's most heavily traveled highways, authorities said.
While we're looking at commodity prices, let's look at agricultural prices because they have also been spiking
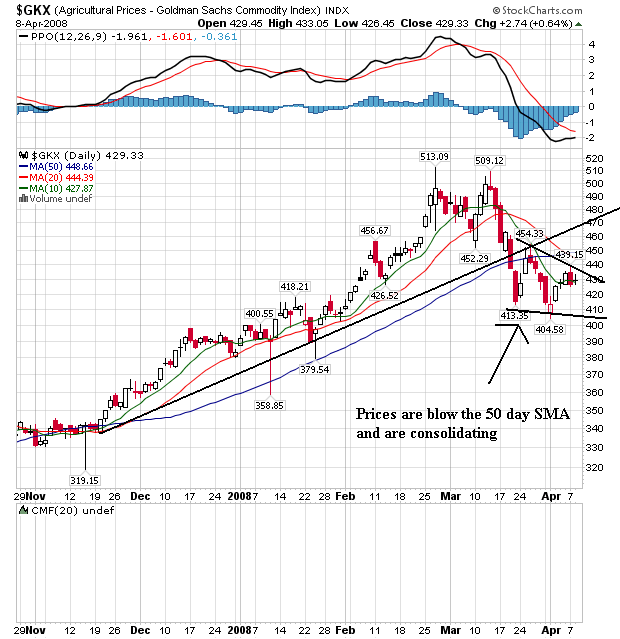
On the daily chart, notice the following:
-- Price have broken through the support of an upward sloping trendline started in late November 2007
-- Prices are below the 50 day SMA and are heading lower
-- The 10 day 20 day SMAs are both headed lower and have moved through the 50 day SMA
-- Prices are consolidating below the 50 day SMA
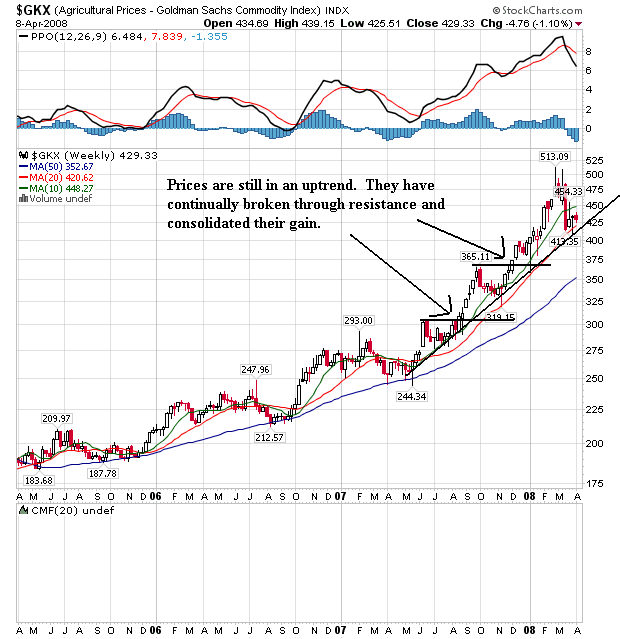
-- Prices have continually moved through previously established resistance and consolidated those gains
-- Prices are still in a confirmed uptrend
The reason agricultural prices are so important is there are food riots in various countries across the globe and governments are curbing exports:
As well as the riots in Egypt, rising food costs have been blamed for violent unrest in Haiti, Ivory Coast, Cameroon, Mauritania, Mozambique and Senegal. Protests have also occurred in Uzbekistan, Yemen, Bolivia and Indonesia.
China, India, Pakistan, Cambodia and Vietnam have curbed rice exports to ensure there is enough for their own people.
Most commodities are priced in dollars. Therefore a dropping dollar is a de factor price increase.
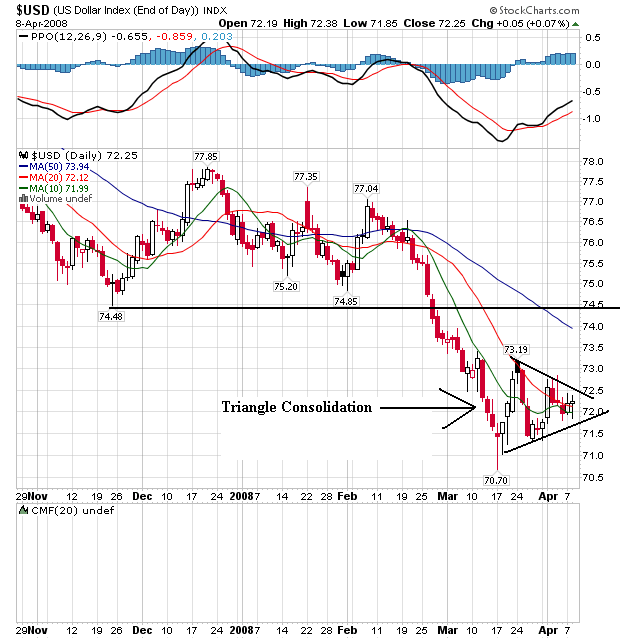
On the daily chart, notice the following:
-- Prices consolidated in the 74 - 77 range from late November to late February.
-- Prices broke through support and have since fallen about 3.3%
-- Prices are consolidating in a triangle consolidation pattern
-- The 10 and 20 day SMAs are bunched together, indicating a lack of direction.
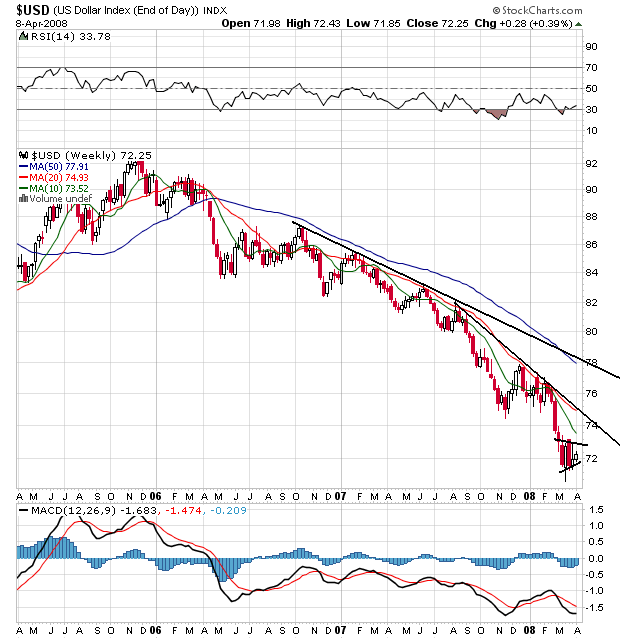
On the weekly chart, notice the following:
-- Prices have continually moved lower, falling through support
-- After falling through support, prices have consolidated their drop and then moved lower
-- The shorter SMAs are below the longer SMAs
-- Prices are below the SMAs
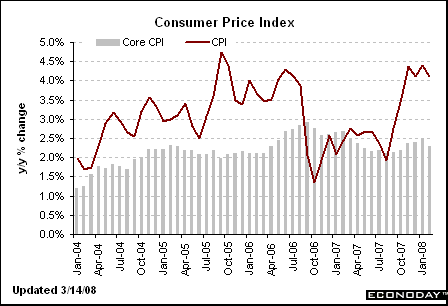
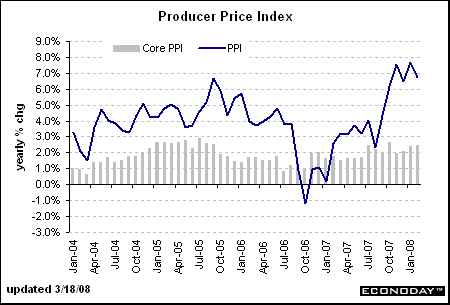
All of this leads to high inflation in the US: