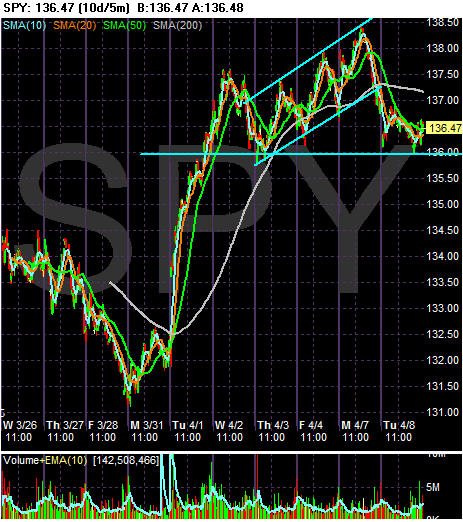
Taking a look at the SPYS chart from left to right here's what we see.
-- A big rally a week ago that peaked on Wednesday.
-- On Wednesday we had a natural sell-off.
-- From Thursday through Monday of last week we say another rally, although this one was a but narrower.
-- Yesterday the market closed below the lower trend line
-- Today we saw a continuation of the sell-off.
-- Notice that 136 is a very important short term level.
-- Also note that if prices break 136, the next level is 135.5

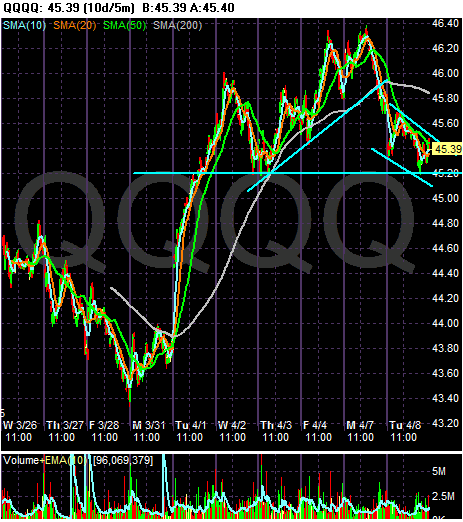
-- The QQQQs also also saw a big rally last Tuesday, followed by another rally on Thursday through Monday
-- Notice there was a possible double top on Friday and Monday
-- Also notice prices are in a downward sloping trendline
-- 45.20 is a very important level. If we break through this level than 44.80 becomes the next level of support

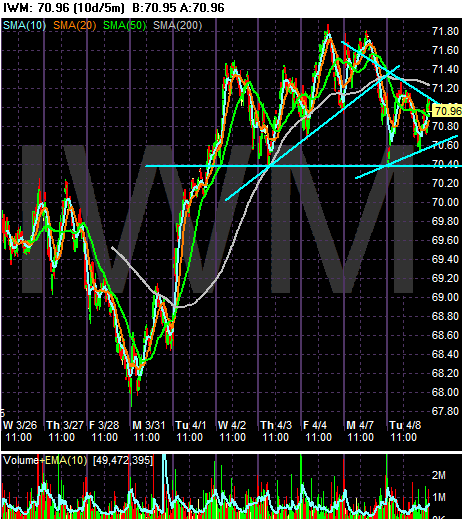
-- A great deal of overlap with the QQQQ and SPY analysis with the following differences
-- Notice the triangle consolidation pattern yesterday and today
-- 74.40 is an important level, although IWM prices are a bit above their respective support levels than the SPYs or QQQQs
Because the markets usually trade in tandem, a drop by the SPYs through their support level would not be good for the markets overall. That would pull the markets lower in a big way.