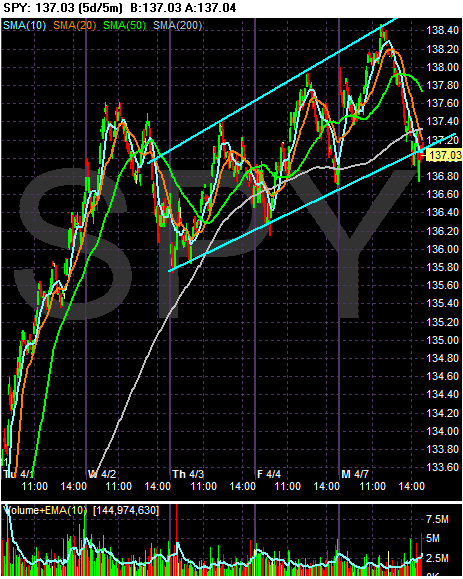
The SPYs break is small but noticeable. The key here is tomorrow's move. Usually prices have to break a trend by a certain amount for the trend break to be a "real" break. In his book on technical analysis, Pring suggests a break of 3%. For a shorter term chart, I would use a smaller figure.
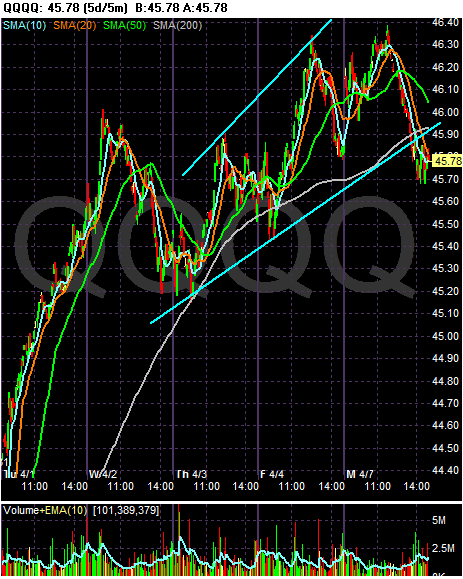
Notice the QQQQs dropped a bit father through their trend line.
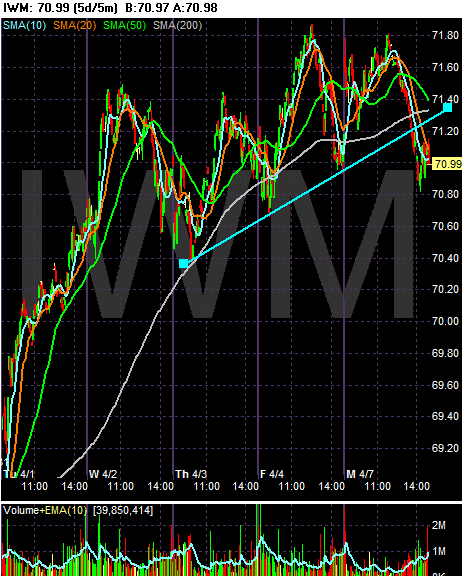
And the IWMs broke through their trend with a bit more gusto as well.
The daily charts show an interesting story.
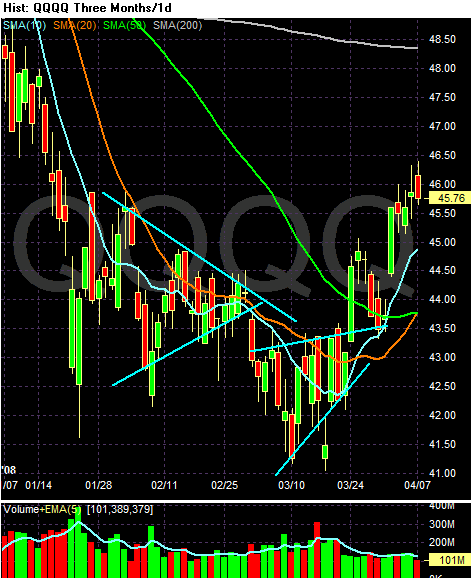
The QQQQs daily chart is the first chart that caught my attention. Notice the following:
-- The 10 and 20 day SMAs are heading higher.
-- The 10 has crossed the 50 day SMA and the 20 will cross the 50 day SMA tomorrow
-- the 50 day SMA is heading higher
-- Prices are higher than all the moving averages
-- Prices are in the middle of an uptrend
-- A big drawback to this chart is the lack of volume
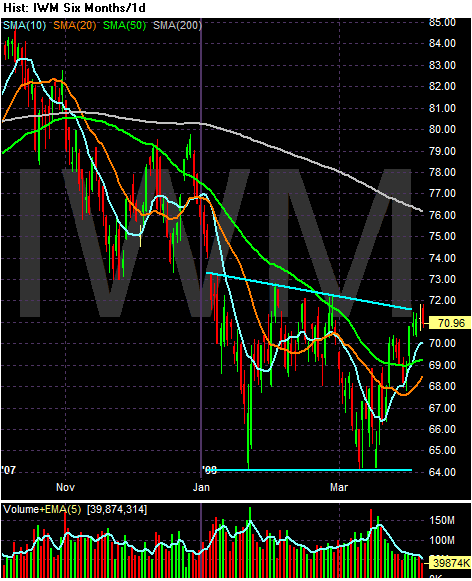
On the IWMs notice the following:
-- The 10 and 20 day SMA are moving higher
-- The 10 day SMA crossed the 50 day SMA and the 20 day SMA will cross the 50 day SMA withing a week or so
-- Prices are above the 50 day SMA
-- Prices are in an uptrend
-- Prices are hitting upside resistance
-- As with the QQQQs, there is a lack of volume that is very disconcerting
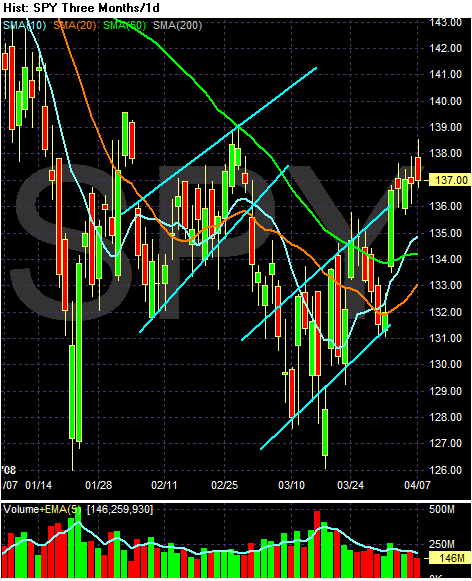
On the SPYs, notice the following:
-- The 10 and 20 day SMA are moving higher
-- The 10 day SMA crossed over the 50 day SMA
-- The 20 day SMA will cross over the 50 day SMA within a week or so
-- Prices are higher than the SMAs
-- Prices are in an uptrend
-- There is also a lack of volume
So on the daily chart we have a lot of positive developments except a lack of volume. That means an overall lack of buying interest which is not encouraging.