The nation's retailers reported the weakest March sales in 13 years on Thursday as consumers -- fretting about mounting economic problems and enduring a frigid Easter -- limited their shopping to food and other essentials.
With prices at the pump rising and worries about jobs increasing, shoppers bought basics at discounters and wholesale clubs and snubbed mall-based chains' clothing, jewelry and furniture. The earliest Easter in 95 years also hurt sales; shoppers weren't in the mood to buy spring clothing in cold weather.
Wal-Mart Stores Inc. and Costco Wholesale Corp. were among the best performers. Wal-Mart raised its earnings outlook, noting that better inventory control helped to limit markdowns on merchandise.
But March proved to be another weak month for many others, including J.C. Penney Co., Gap Inc., and Limited Brands Inc. All of them reported sharp drops in sales.
"Discounters are going to continue to do well in this economy," said Ken Perkins, president of RetailMetrics LLC, a research company in Swampscott, Mass. "Anything that is discretionary is going to continue to be under pressure."
Here's a link to a sortable chart from the WSJ.
The bottom line is weakening job growth
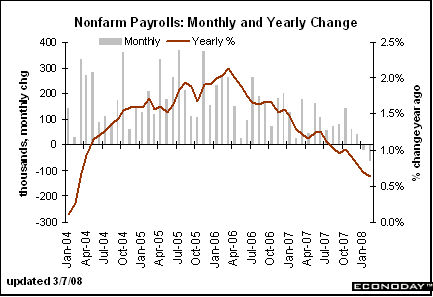
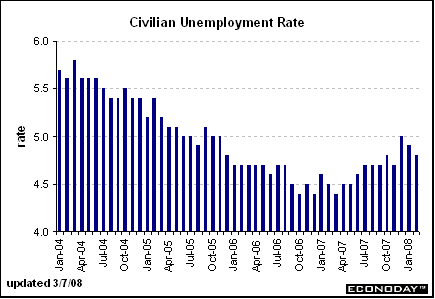
Rising unemployment (although still at low levels)
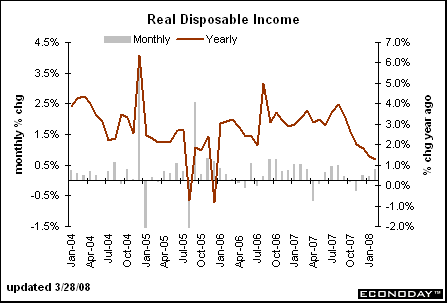
Declining disposable income
Leads to lower confidence
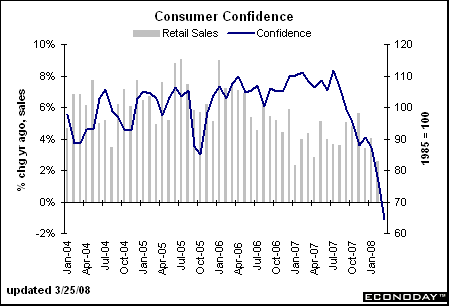
And sentiment
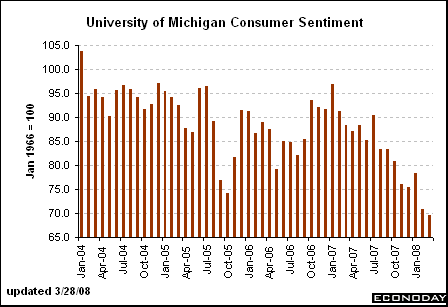
Which lowers sales.
Let's take a look at the retail sector chart across a set of time frames
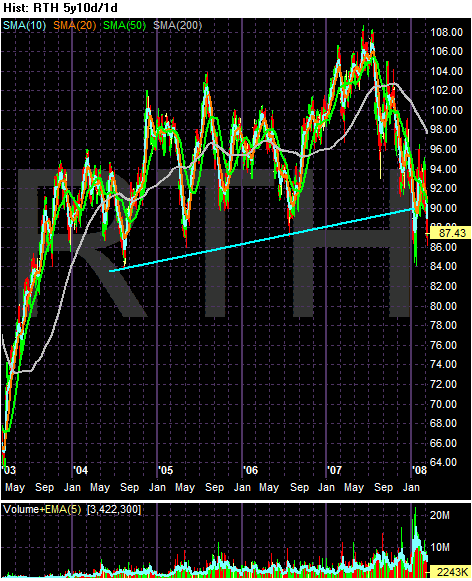
On the five year chart, notice the following:
This is a daily increment chart. Notice how prices are moving around the 200 day SMA. While there is a slight upward slope to the line, this is not the strongest slope we've ever seen. It's as much trading range as it is a rally.
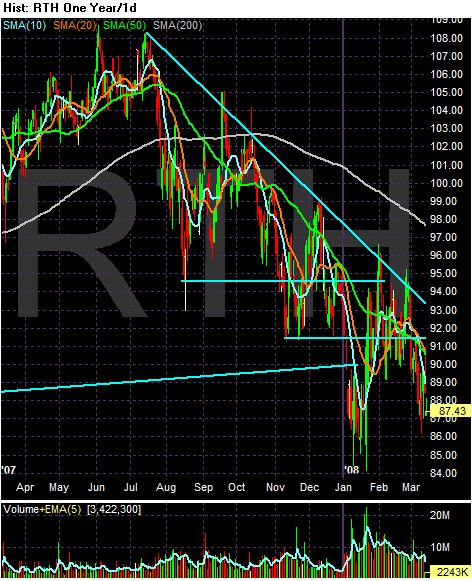
Starting in July of last year, notice the chart starts to move lower in a big way. The chart is making lower lows and lower highs. Also note prices are about 10.6% below the 200 day SMA, indicating we're in a bear market area.
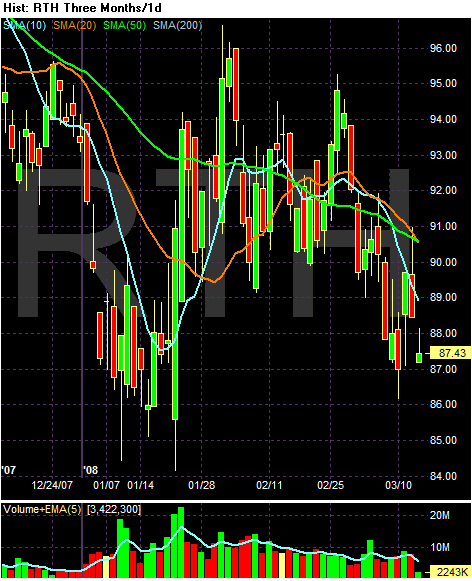
On the three month SMA chart, notice the following:
-- Remember that prices are below the 200 day SMA
-- The shorter SMAs are all moving lower
-- The 10 is below the 50 and the 20 is about to cross below the 50
-- Prices are below all the SMAs
Short version: this chart says sell me.