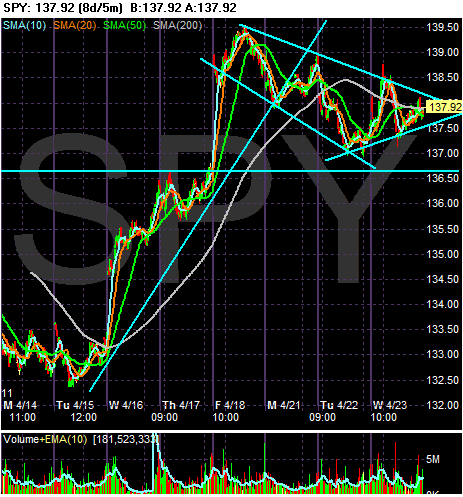
From 4/15 to 4/18, the SPYs were rallying. As the chart above shows, the SPYs have been in a standard pennant pattern for the last three days. However, it shoul dbe raising some concern that the SPYs rose big time early this morning and couldn't hold their momentum.

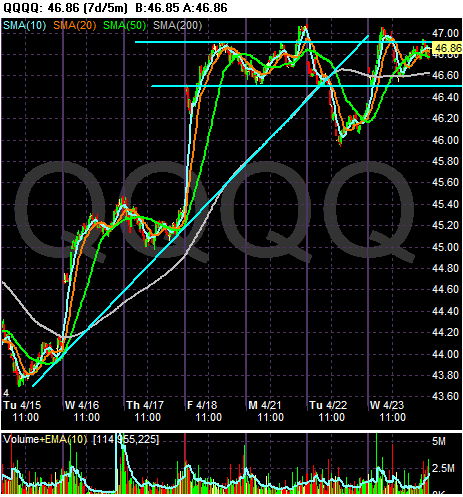
Save for their big drop yesterday, the QQQQs have been in a pretty tight range for the last 4 days, fluctuating between 46.50 and 47.

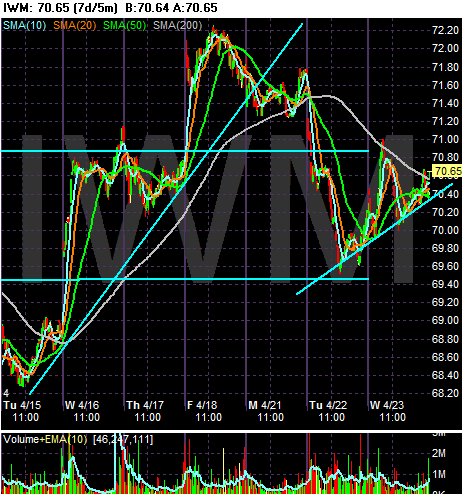
The IWMs are clearly off their rally right now. For anyone looking for a further market rally, this chart should raise a few eyebrows. The IWMs are a good indicator of risk capital. Lack of rallying in this area of the market tells us that risk may not be on everybody's mind right now.