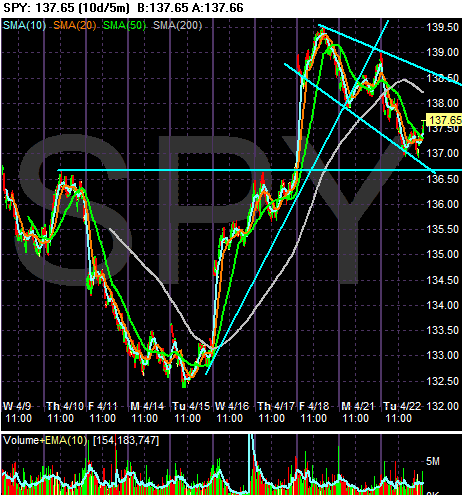
As the chart shows, the SPYs were rallying all of last week, rising from 132.50 to 139.50. So a sell-off is to be expected. Notice that action for the last two days is a straightforward pennant formation. Also that when you pull the lens back, the selling is pretty disciplined -- a drop followed by a rally (although to a lower level) and then a drop. Bottom line, the last two days looks like a standard sell-off.

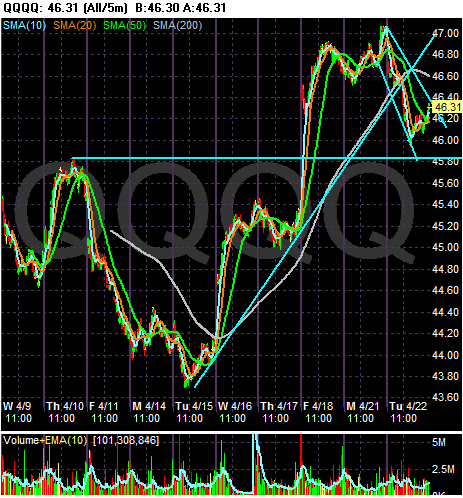
Notice the QQQQs action is pretty much just like the SPYs with the exception that the pennant formation occurs over a day rather than 2. Notice the QQQQs have an important support level at 45.80.

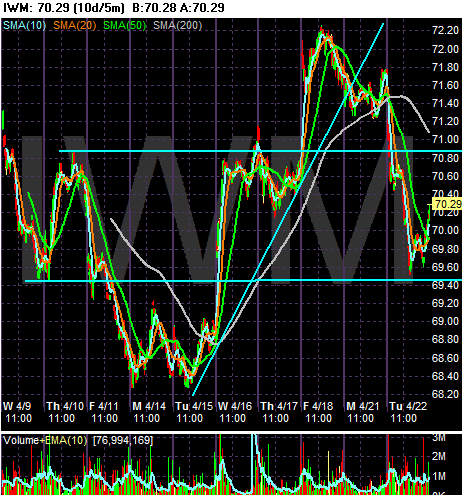
Notice the depth of the sell-off in the IWMs. This is not a standard correction where traders are simply taking profits; this is a hard-core big time sell-off. The reason is the IWMS are considered riskier, so people will leave this area of the market.

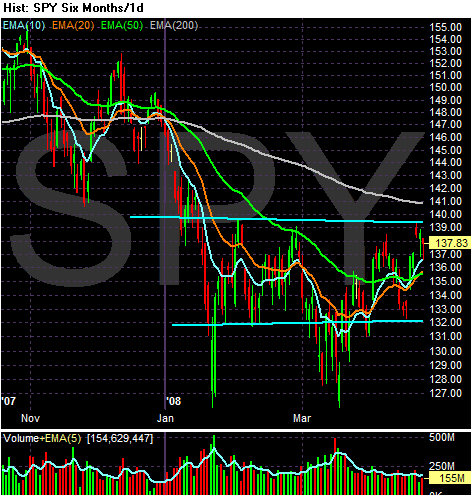
Let's look at a six month SPY chart and ask an important question: is this a base for a rally? There are plenty of indications it is. Notice the possible double bottom with the first occurring in late January and the second occurring mid-March. Also notice that with the exception of the two double bottom points prices are been in a fairly tight range from 132 - 139. While there has been plenty of bearish news, prices have found incredibly strong support at 127 and again at 132. The latter level has seen three support rallies since February, although prices did move below that level once. However, no chart is perfect.