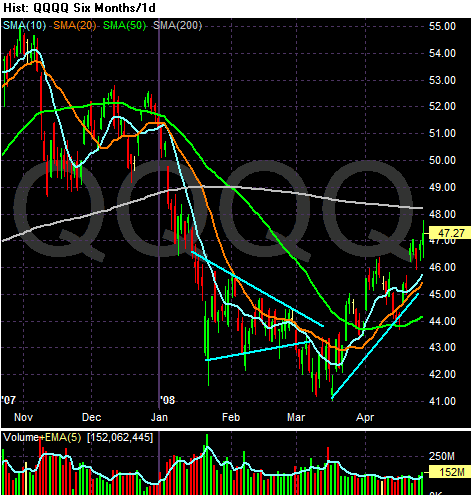
This is the chart that originally caught my attention a few weeks ago. It led me to believe we may be in the middle of a turnaround. Notice the following:
-- Prices have increased almost 10% since mid-March
-- Prices are above the shorter SMAs
-- The shorter SMAs are above the longer SMAs
-- All the shorter SMAs (10, 20 and 50) are moving higher.
There is one problem with the rally theory. Market breadth on the NASDAQ stinks:
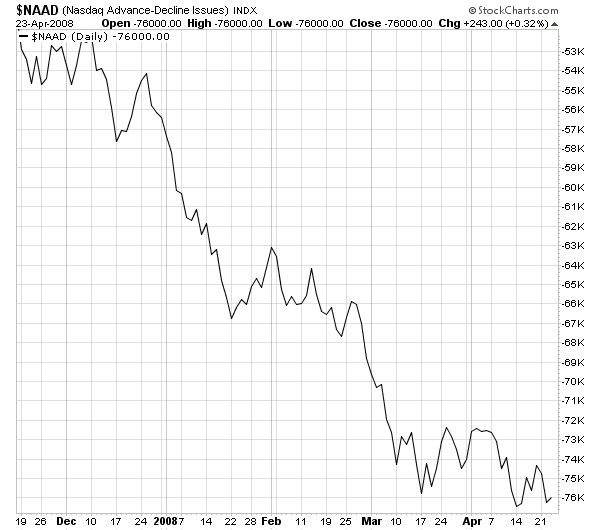
Market breadth hasn't moved higher with the market, and
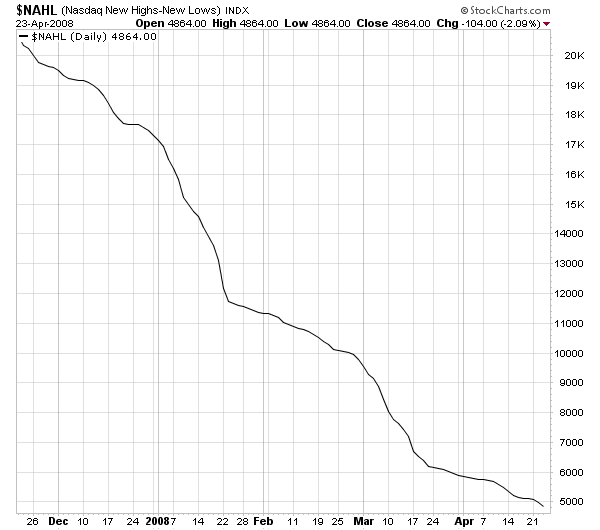
The new highs/new low number has been decreasing as well.
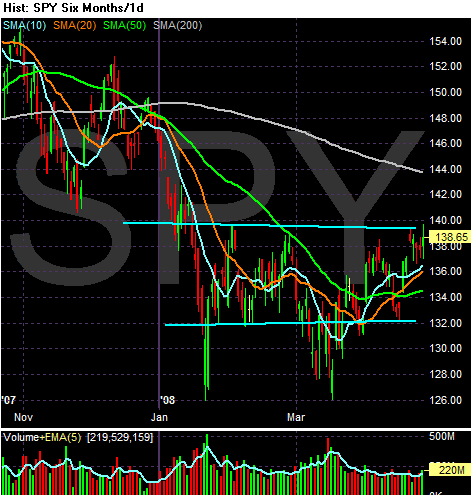
On the SPYs, notice the average could be building a base to rally from right now. But also notice the SPYs have not been able to move the 138 - 140 area since earlier this year.
However, the SPYs have seen much better market breadth numbers.
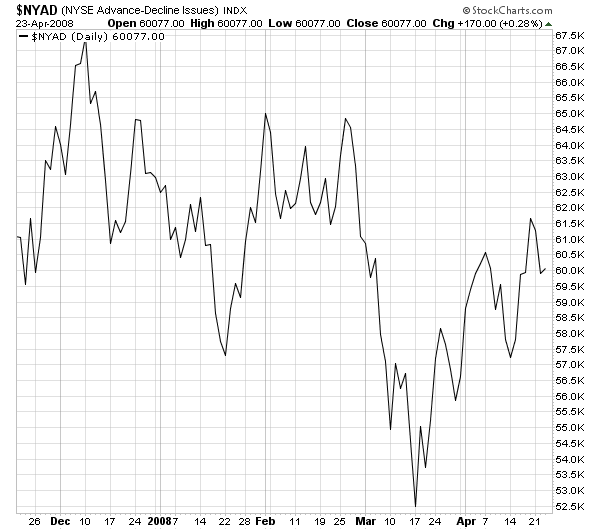
The advance/decline line is actually increasing,
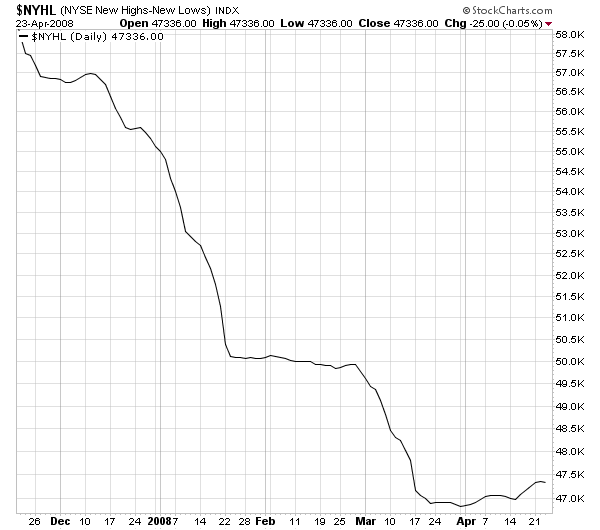
And the new highs/new lows number is moving up a bit.
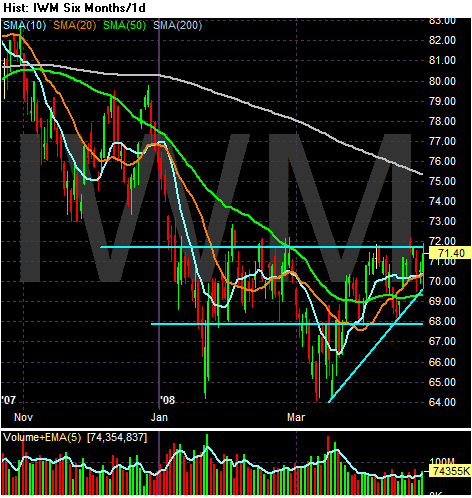
And despite a rally from the IWMs from 64 to about 71, they have not been able to move beyond 72.
The lack of breadth on the NASDAQ -- especially the declining new highs/new lows numbers -- takes a lot of strength away from the bulls case. However, the SPYs advance/decline line is good. If we see the SPYs or the IWMs break out of their respective areas of resistance, then I think we can say that we're in a rally.