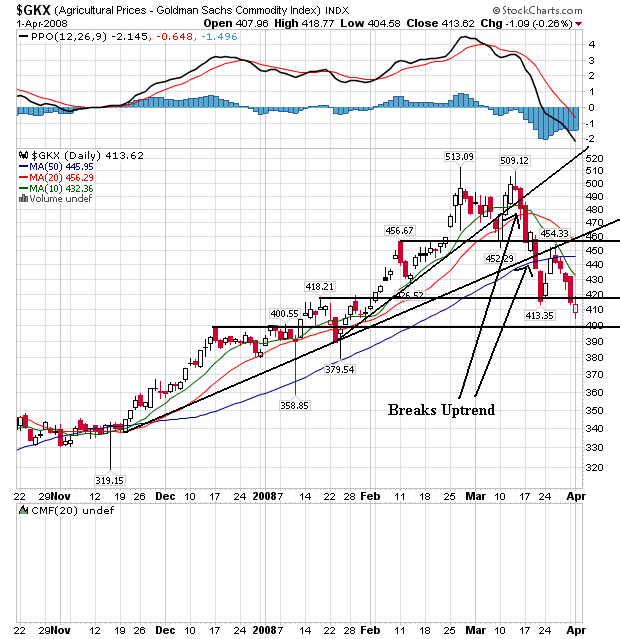
On the daily agricultural price chart, notice the following:
-- Prices have broken through two support levels
-- Prices have broken through two upward sloping trend lines.
-- The 10 day simple moving average (SMA) has moved through the 50 day SMA
-- The 10 and 20 day SMA are both heading lower
-- Prices are now below the 50 day SMA
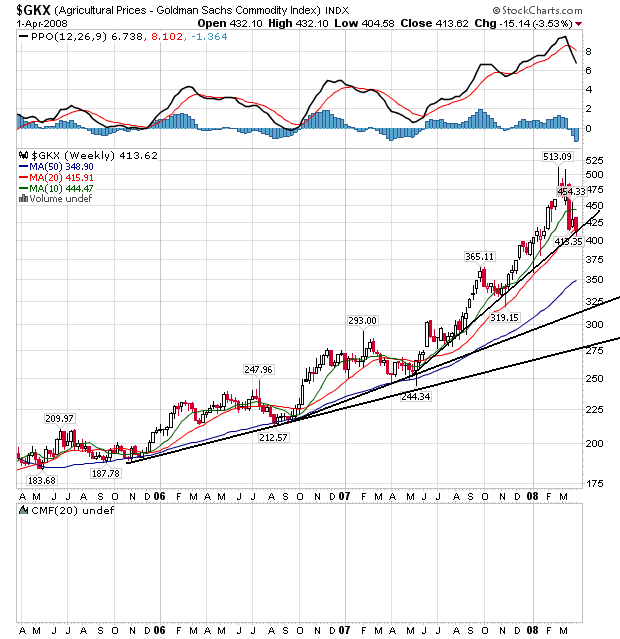
On the weekly agricultural price chart, notice that
-- Prices are at a crucial technical level. While they are still technically in an uptrend a move through this level will indicate a break of the trend.
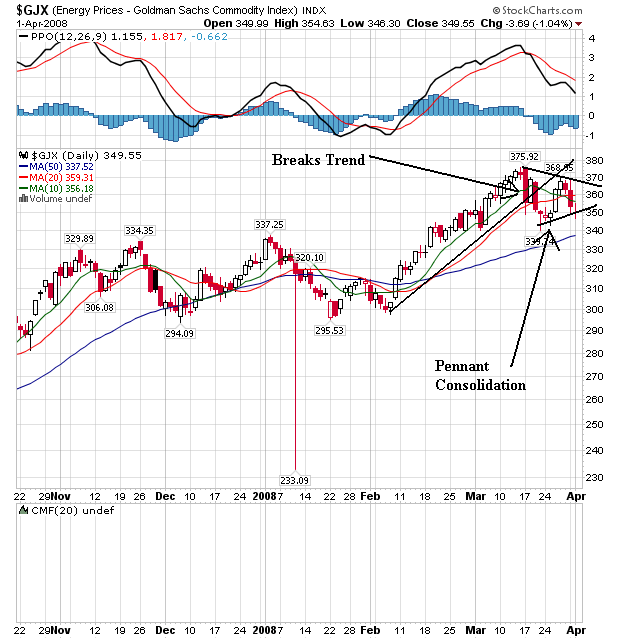
On the daily energy price chart, notice the following:
-- Prices broke the trend line started in early February
-- Prices are consolidating in a triangle pattern right now
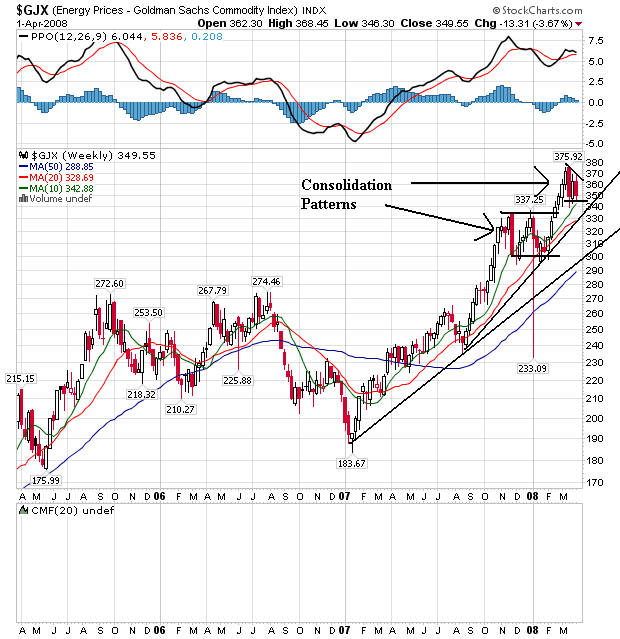
On the weekly energy price chart, notice the following:
-- Prices are still in an uptrend that started at the beginning of 2007
-- Prices are currently consolidating in a triangle consolidation pattern.