The mostly negative news has caused a surge of buying interest, with the thrifts & mortgages (+8.7%), diversified financials (+7.0%), and consumer finance (+6.7%) groups posting steep gains. However, there were similar rallies on negative news as early as October on hopes that the worst of the subprime mess was over--which clearly was not the case. Whether this really ends up being the turning point remains to be seen, but as of now there is a bullish bias prevalent within the market.
There are also some other points to consider. First, this is the beginning of the second quarter, so managers are putting money to work. There is also talk of a Federal bail-out of the mortgage market that might be boosting sentiment. The ISM number came in better than expected (although it was still below 50 indicating we're in a contraction) which may have helped as well.
But I have to wonder about the fundamental backdrop. I think it's possible the Fed has removed downside risk from the market by allowing a broader group of firms to borrow at the discount window. But that doesn't mean things are rosy either. Construction spending was terrible. Lehman had to raise cash, UBS said it has massive writedowns (as does Deutsche Bank) and car sales were terrible. All in all, things just aren't that great which leads me to question the long term viability of this rally. I should add -- I've been wrong before.
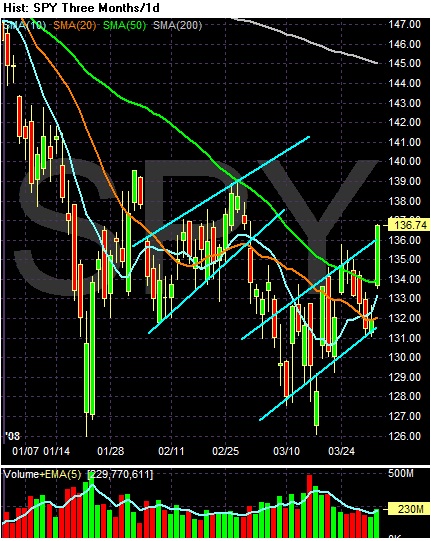
I'm going to use the daily charts because they really illustrate the market's overall situation better right now.

On the SPYs, notice the formation of two bear market flags. Also notice that today's price action takes prices above the upper trend line for on of those flag patterns. Finally, notice the SPYs could be forming a double bottom with the first occurring mid-January and the second occurring in mid-March.

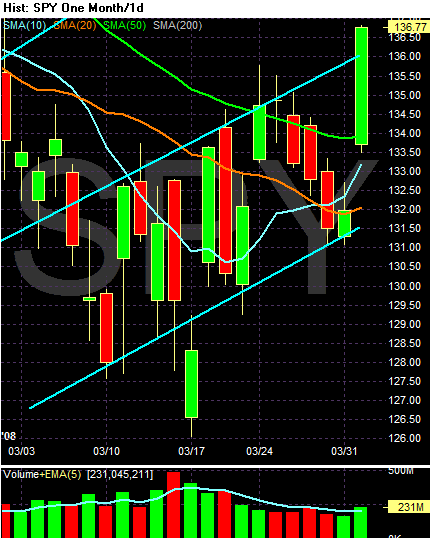
Above is just a closer look at the indexes move today.

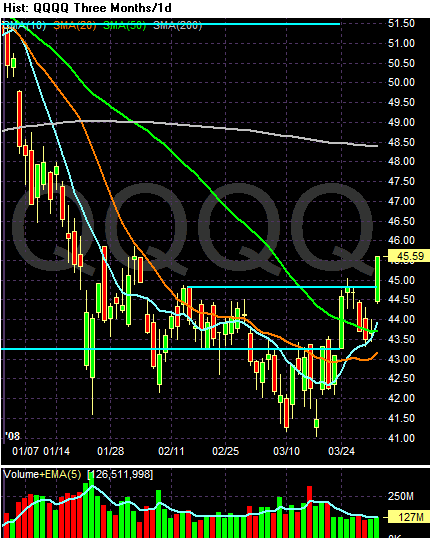
The QQQQs offer the most positive chart. Notice the following:
-- Prices have moved through resistance levels with a great deal of strength.
-- The 10 day SMA crossed the 50 day SMA and is moving higher.
-- The 20 day SMA is about to cross the 50 day SMA and is about to turn positive.
-- Prices bounced off the 10 day SMA and moved higher.

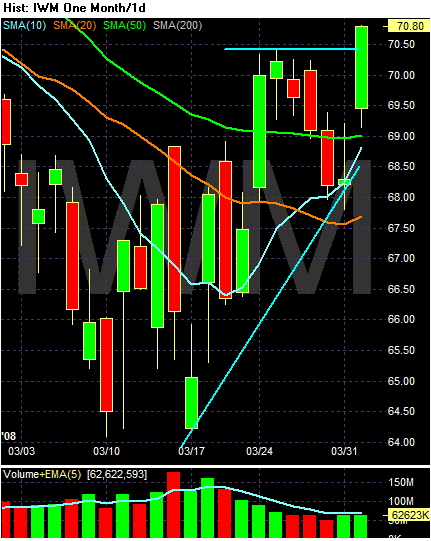
Above is a month-long look at the IWMs. Notice the following:
-- The 50 day SMA has smoothed out.
-- The 10 day SMA is about to move through the 50 day SMA
-- Prices have moved through all the SMAs
-- Prices are in a clear uptrend