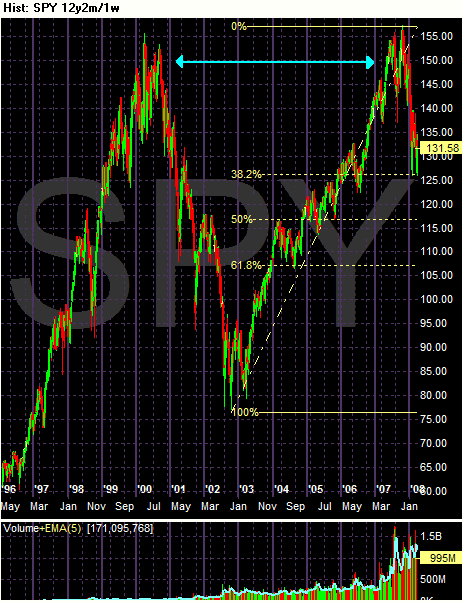
This is a fifteen year chart in weekly increments. Notice the following.
-- We're clearly in the middle of a multi-year double top. The first top occurred in 2000 and the second top occurred in 2007.
-- Notice that prices are at roughly at the 38.2% Fibonacci retracement level for the rally that started in late 2002/early 2003.
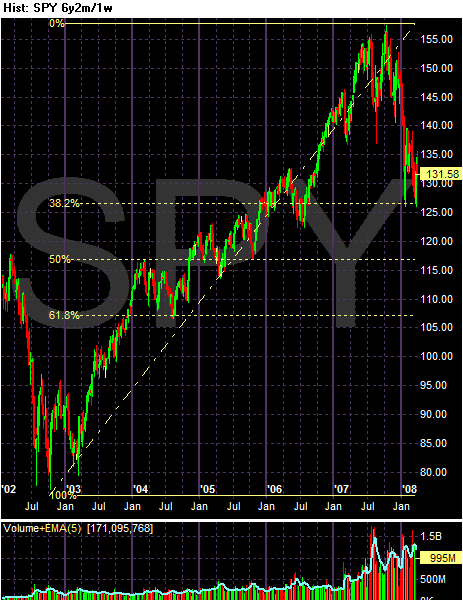
Above is an in-depth look at the Fibonacci levels from the previous examples. Also notice the double top that occurred in this rally with the two tops occurring in the second half of 2007
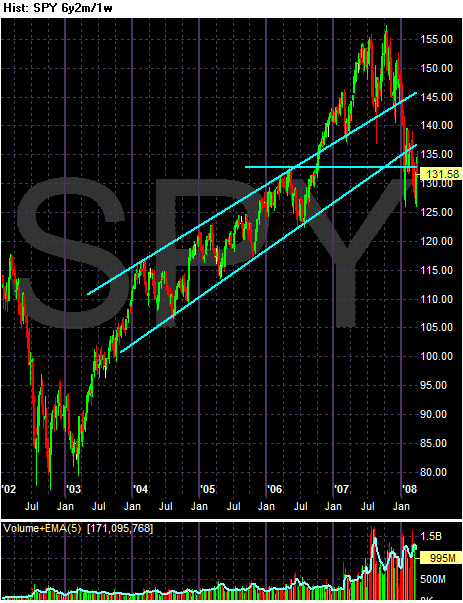
On the above 6 year chart, notice the following.
-- The rally that started in mid-2003/early 2004 had two channel lines.
-- The market has broken through both channel lines.
-- The market is currently at an early 2006 price level.
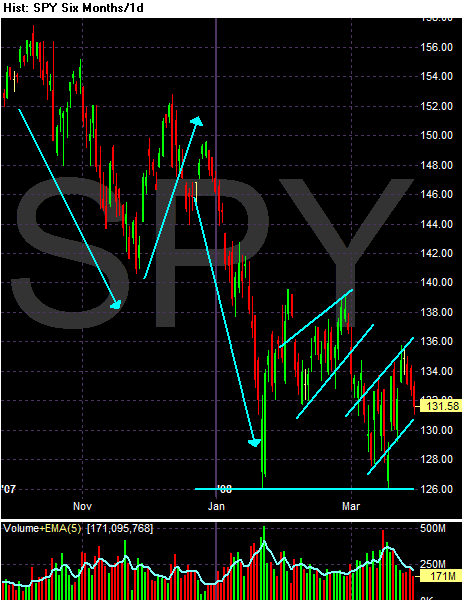
On the six month chart notice the following:
-- Prices were in a clear down, up, down pattern.
-- Notice that prices have formed two bear market flags since the first of the year.
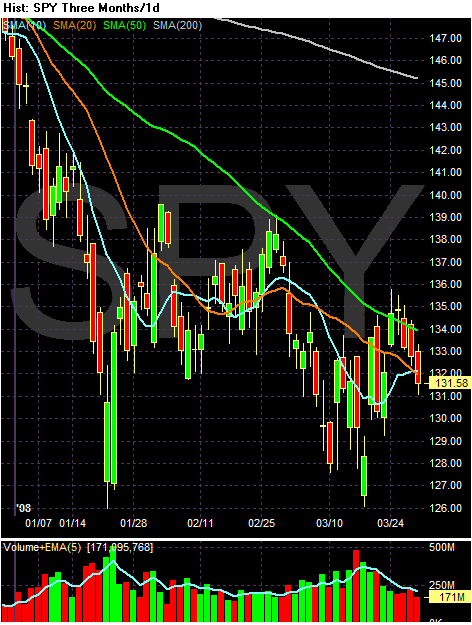
On the SMA chart, notice the following:
-- the 20, 50, and 200 day SMA are all moving lower
-- Prices and the 10, 20 and 50 day SMA are pretty bunched up right now. All are within 3 points of each other.
Conclusion: There is a great deal of support in the 126/127 area. The market has hit those levels twice and bounced back. Because of the two bottoms in that area the market could be forming a double bottom. But that has to be considered against the economic/fundamental backdrop. While the market can be a leading indicator, I don't think we've had enough pain for the market to be rebounding in anticipation of a recovery just yet.