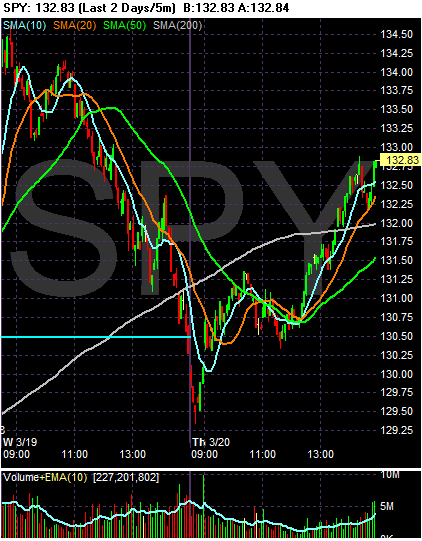
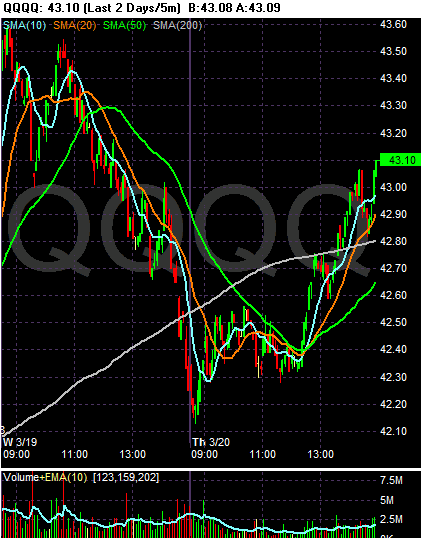
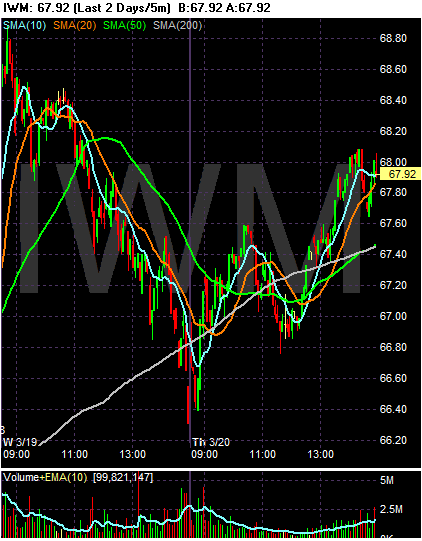
Looking at the daily/SMA picture we get something a bit different.
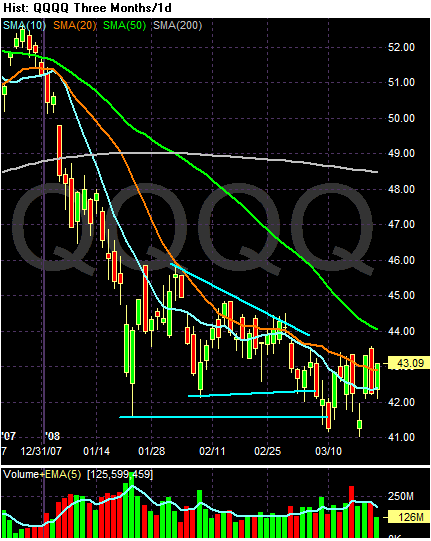
The QQQQs are locked in tight with their SMAs with everything about even right now. In other words, traders are looking for a direction for the market to go.
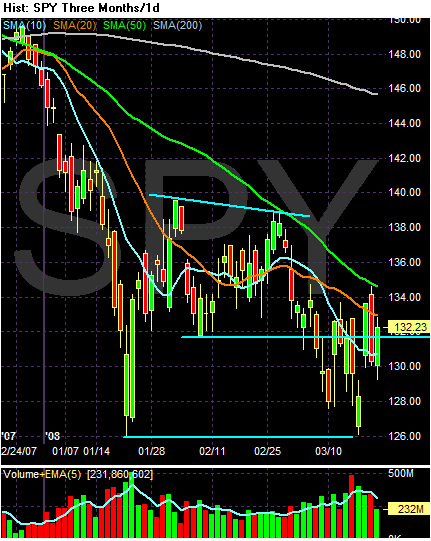
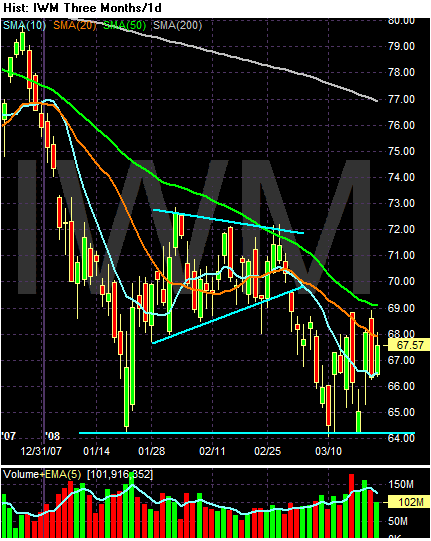
With the SPYs and the IWMS notice:
-- The SMAs are all moving lower
-- The shorter SMAs are below the longer SMAs
-- Prices are right between the 10 and 20 SMAs
Also note that prices -- with the exception of a drop down 4 days ago -- have been in an incredibly tight range for about a week or so.