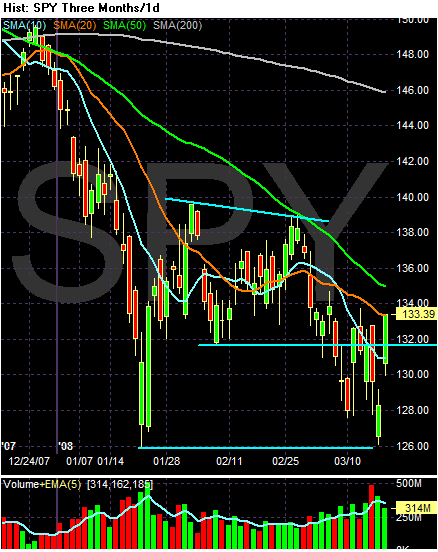
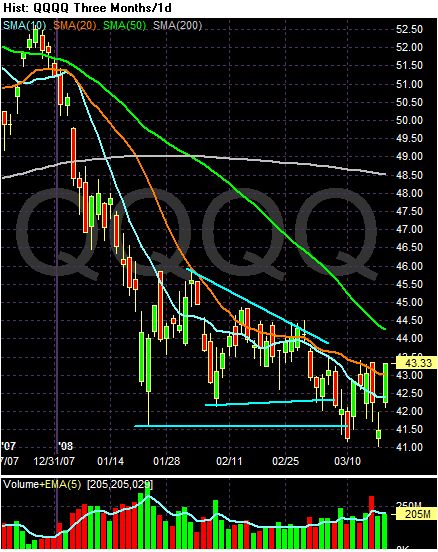
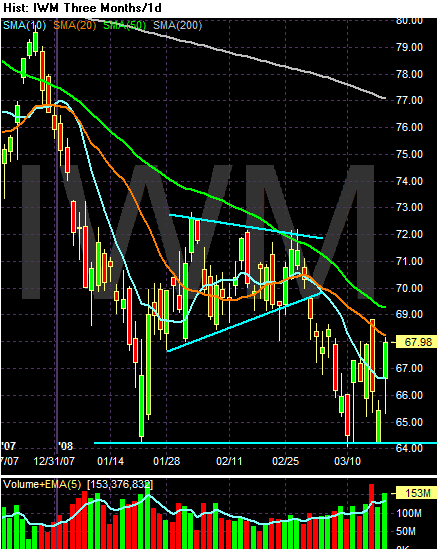
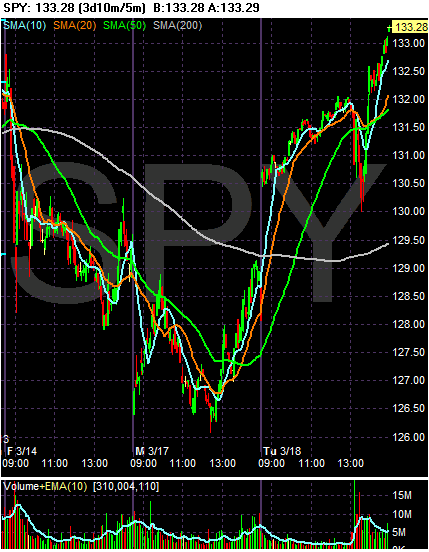
The markets didn't quite know what to do with the Fed's news. First they sold off, probably because the cut was only 75 basis points. But the market then realized they were still getting a sizable cut, so everybody moved higher.
If you look at the three day charts, it looks as though we're in the middle of a turnaround.
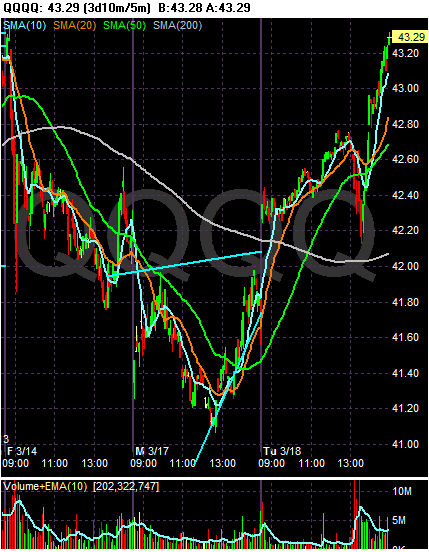
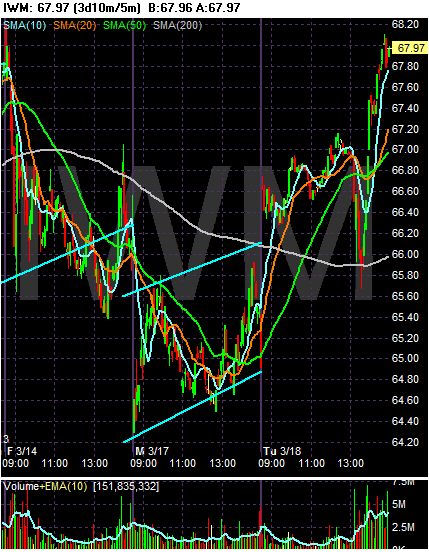
On the daily charts notice tow things.
-- on all the charts, the last two days look like a bounce from a very low (as in yearly low) position. Once again, the Fed's rate cut came at a technically good time.
-- We could possibly be forming a double bottom, with the first bottoms occurring in mid-lat January and the second bottom occurring now.
