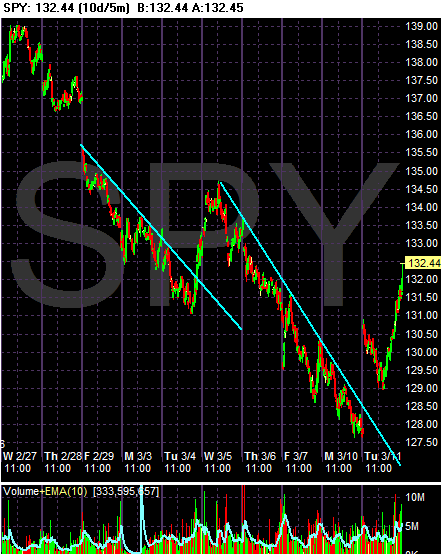
Starting on February 27, the SPYs continued to move lower for four straight days. There was a huge gap down on Feb. 29. The rally on 3/4 was caused by a rumor that Ambac had a rescue plan. However, after the end of that rally, the markets continued to move lower for another 4 straight days. Then we had yesterday's rally caused by the Fed.
Yesterday's rally was impressive. The market opened higher, sold-off, and then moved higher until the close. The market closed near high points for the day on high volume.

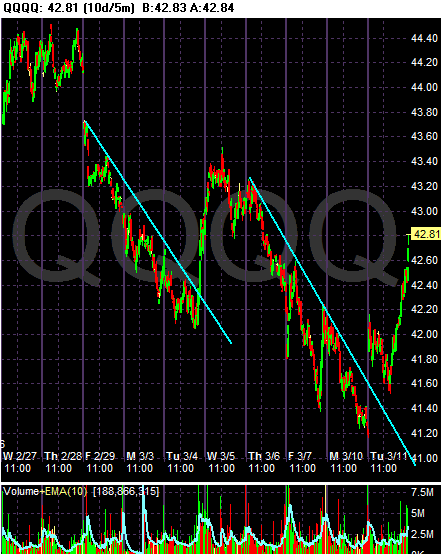
Much of the SPY analysis applies to the QQQQs. The main difference is a triangle consolidation pattern on 2/27 and 2/28.

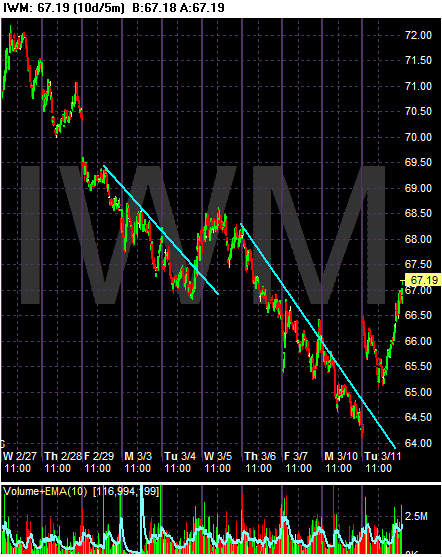
The SPYs analysis applies to the IWMs.
To reiterate -- all of these charts are still primarily bearish. Notice the clear down trends occurring. Basically, we have a downward moving market with bullish counter-trends. However, if recent market action is any indication, we can expect the market to return to a downward sloping trend fairly soon.