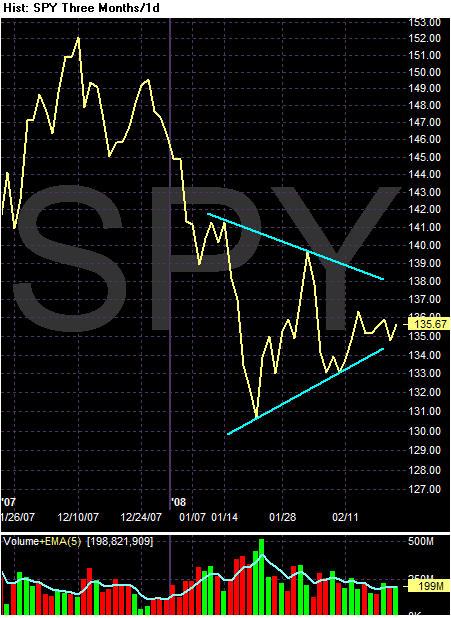
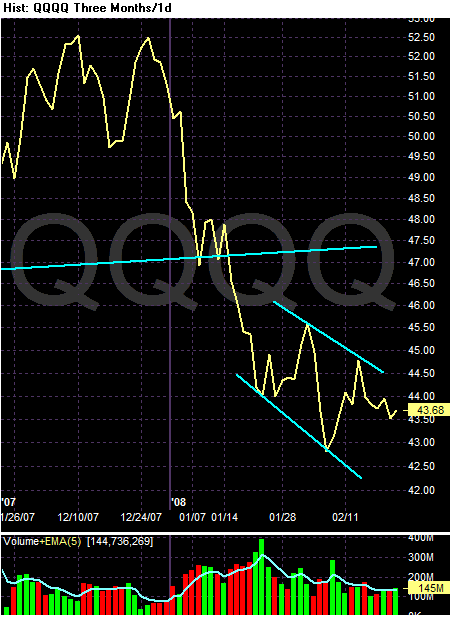
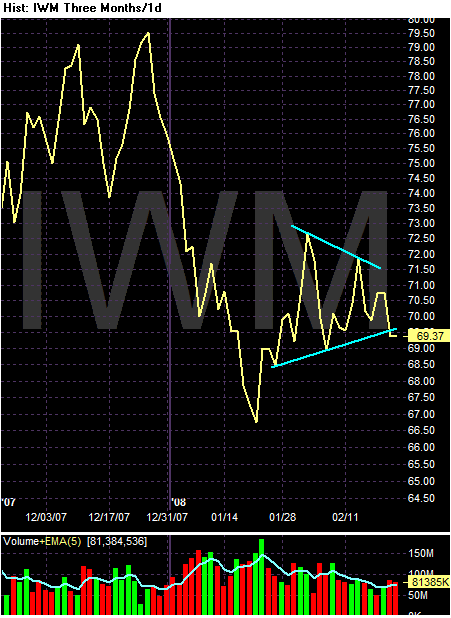
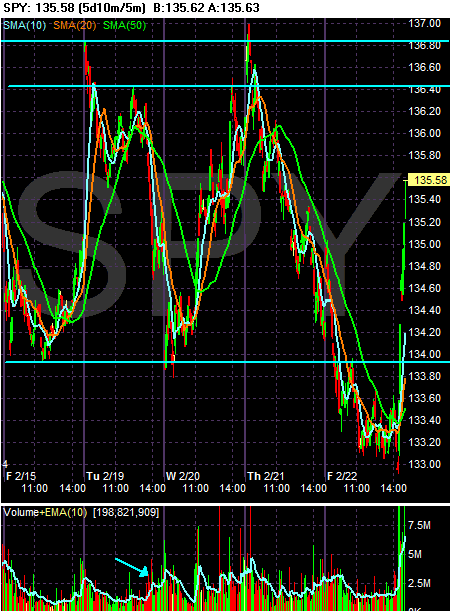
Anyway, last week the markets were in trading range. Technitions can differ about where the actual support and resistance lines are, but they're still very obviously there.
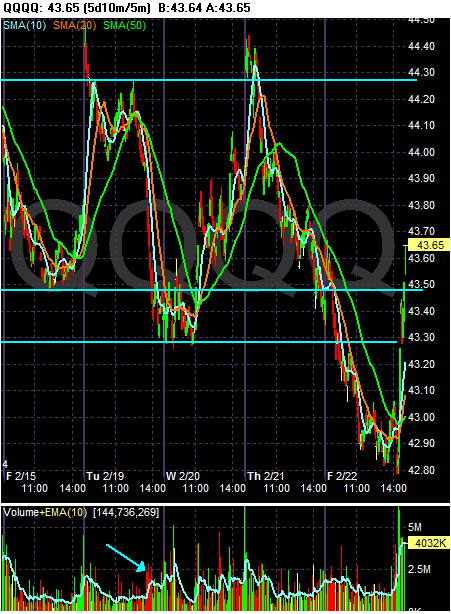
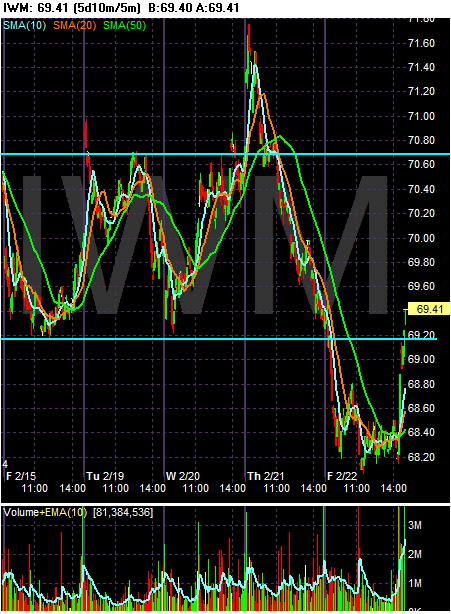
And to clear out the noise on the daily charts, here are the line charts of the above charts respectively.
