Last week's follow-through may have marked a bullish turn in the market, but that doesn't mean investors should be in a hurry to buy stocks.
Why? There just aren't many compelling candidates. A strong new rally typically yields a rash of breakouts by new leaders within a few weeks of the follow-through rally confirmation.
This week's IBD 100 is comprised of few new names, especially those with superior fundamentals. That indicates a lack of sector rotation, or emerging leadership.
Meanwhile, much of the market's old guard is still deep in corrections.
Some of their basing patterns show flaws. So even if they look more promising as they build the right side, you need to make sure the stock meets all your fundamental and technical criteria.
Market breadth is an extremely importance coincident indicator. The underlying reason is simple. A rally should attract buyers who continue to bid up more and more shares. As this process continues, more and more shares should make new highs. The reverse is also true. As the market declines, more stocks decline in value than advance. This leads to more stocks making new lows instead of new highs.
Here are the market breadth charts which indicate a deteriorating fundamental situation in the market.
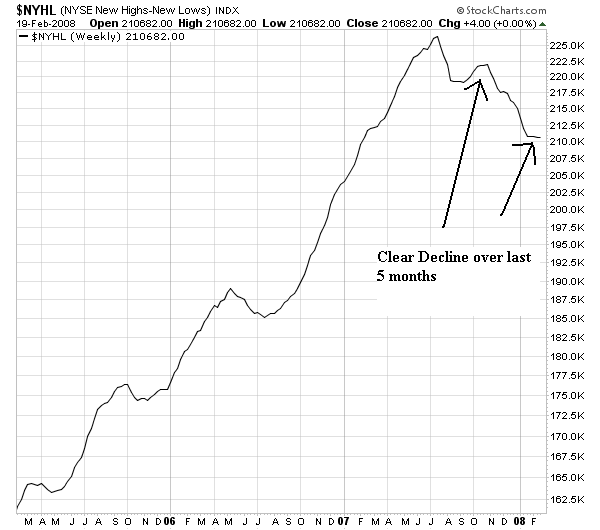
The New York new high/new low chart peaked at the beginning of the third quarter of 2007 and has been declining since.
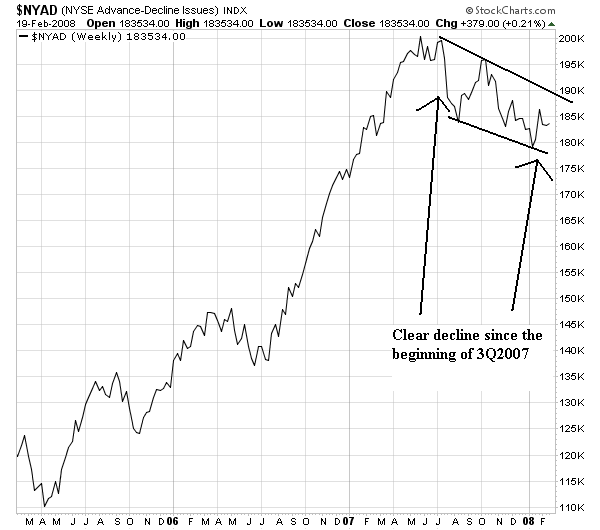
The New York advance decline line is also in a downtrend, although there is clearly some bullish sentiment preventing a big collapse. The decline is pretty gentle and down trends are followed by uptrends.
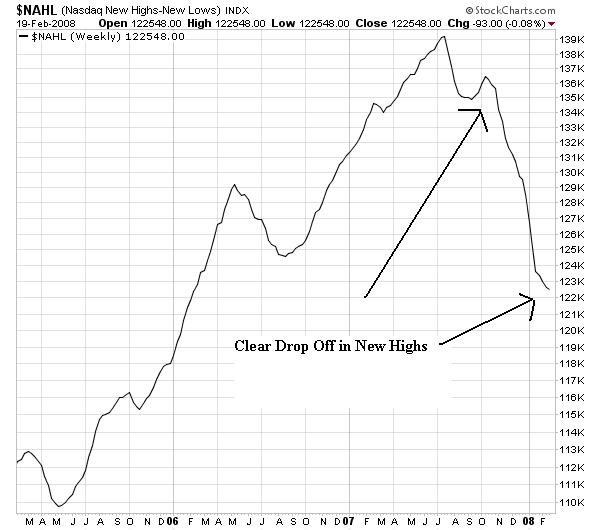
The NASDAQ new high/new low chart has dropped off a cliff.
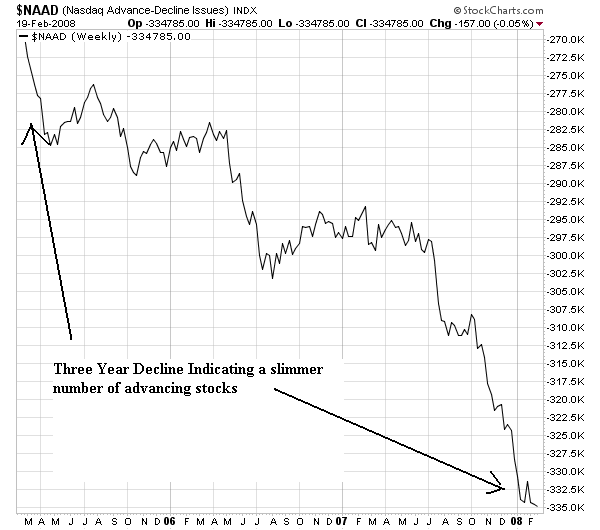
The NASDAQ advance/decline line shows a three year decline, indicating a declining number of market leading stocks.