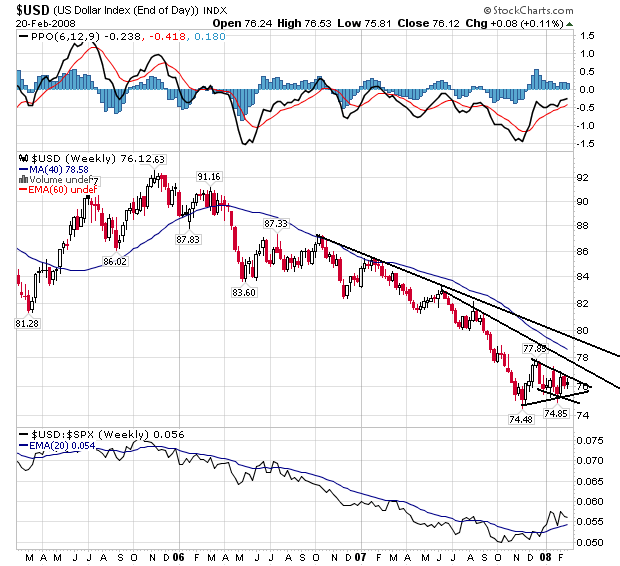
The dollar has been in a downtrend since the beginning of 2006. It has made a clear pattern of lower lows and lowers highs. Also note the accelerated decline since mid-2007 when the Fed started cutting rates.
The dollar formed a bottom at the end of last year, bounced higher and is now consolidating in either a triangle or flag pattern.
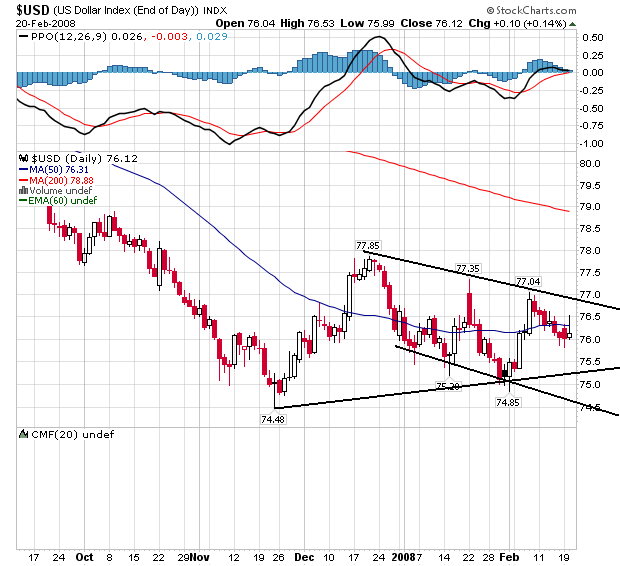
On the dollar's daily chart you can see the consolidation very clearly. I think the most appropriate technical call is a bear market flag, however some analysts may see a triangle consolidation.
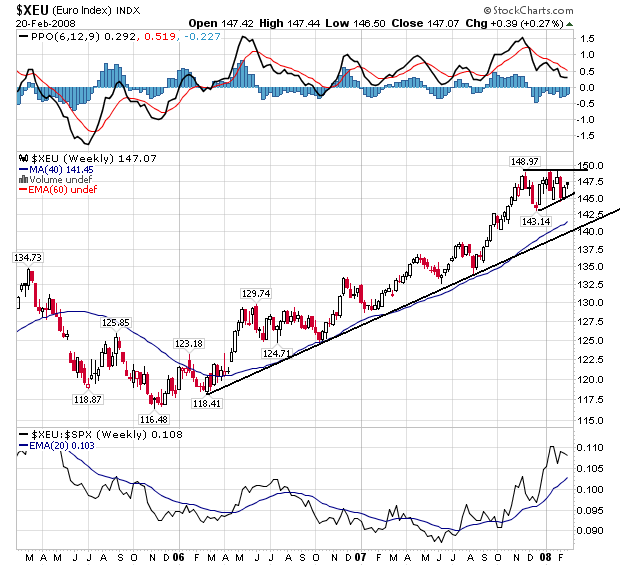
The euro has been the clear beneficiary of the dollar's decline. Notice that since the beginning of 2006 we have a clear rally with higher highs and higher lows. We also have a consolidation pattern that starts in late 2007.
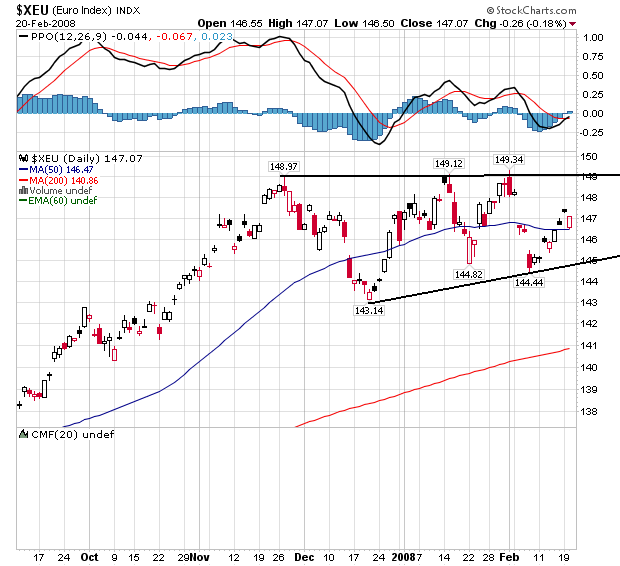
Here is a closer look at the euro's consolidation pattern, which is a clear bull market flag. Also note the euro and dollar chart's are a near mirror image of each other for the last two years.
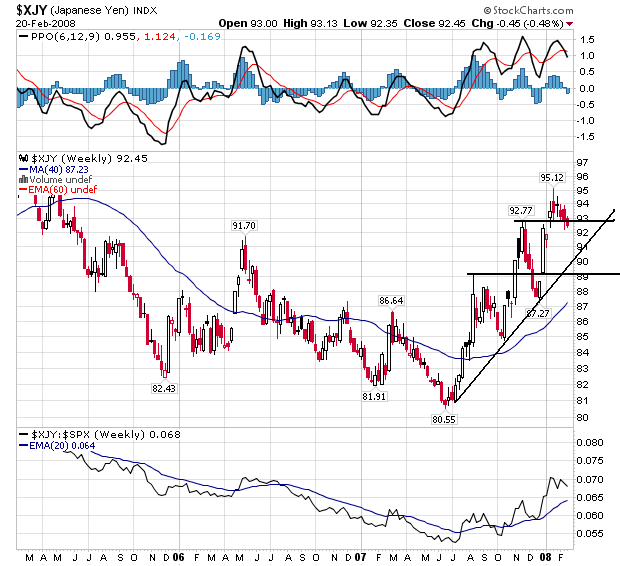
The yen had a rough time from 2005 to mid 2007. The market found a bottom in 2005, bounced higher and then fell to a new low in late 2007. This looks an awful lot like a dead cat bounce to me.
The yen stared a pretty strong rally in mid-2007 making a continued pattern of higher highs and higher lows. However, until it also looks as though the yen is in a giant bottoming pattern for this entire chart (roughly 3 years). Until the yen makes a strong move from this area to say 100 I think we could continue to call the yen in a bottoming formation.
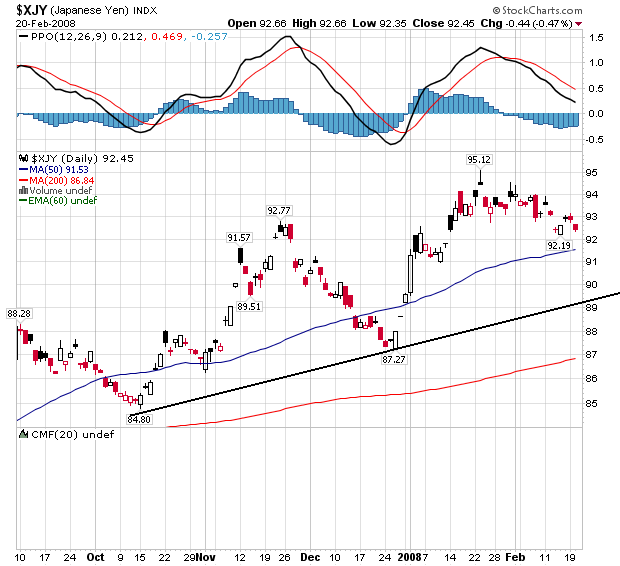
On the daily chart there is a very gentle rally with higher highs and higher lows. But the lack of a serious upward sloping incline makes me wonder about trader's sincerity about the rally. To me, this chart says, "we really want to bid this chart higher, but we're really not sure that's a good idea."
So, what do these charts tell us?
-- The euro and dollar are clearly in direct competition with each other.
-- There is a lot of hesitancy to the yen's chart. The lack of a serious upward incline to the latest rally makes me wonder about trader's underlying conviction. This chart says, "the Japanese economy isn't out of the woods yet, at least not according to traders."