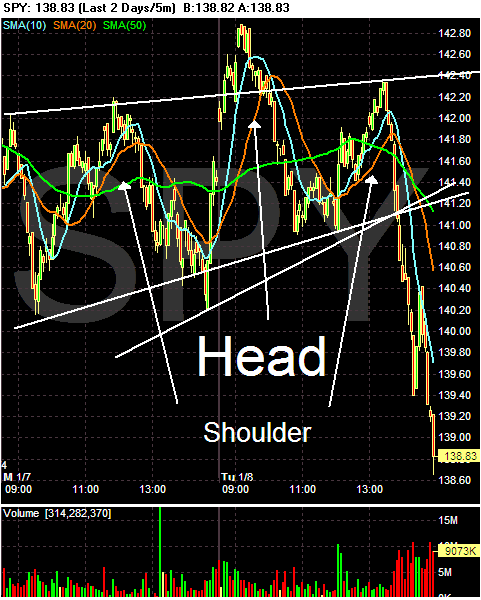
The SPYs either formed a trading channel or a head and shoulders pattern over the last two days. Either analysis is valid and the end result is the same. Notice hte heavy sell-off when the index fell through the lower trendline/neckline. They ended at their low point for the day on heavy volume.
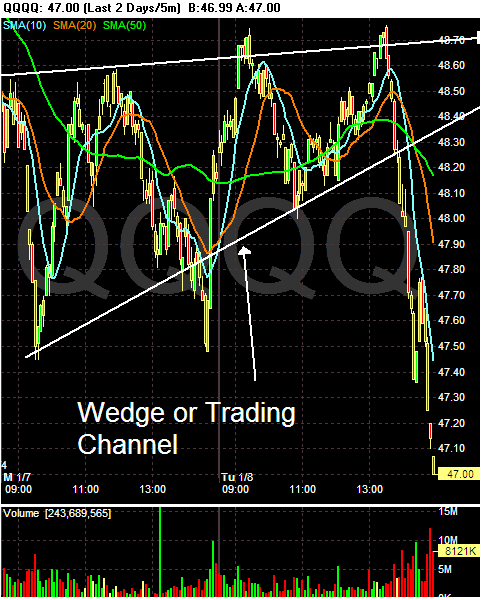
The QQQQs formed a wedge pattern over the last two days and also sold-off on heavy volume when they broke through the lower trendline. They ended at their low point for the day on heavy volume.
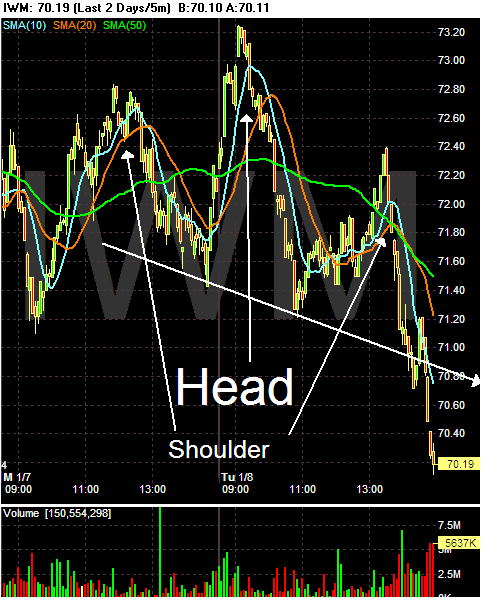
The IWMs formed a head and shoulders pattern over the last two days and also sold-off heavily at the end. They ended at their low point for the day on heavy volume.
A few notes on these charts.
-- All show consolidation patterns
-- All moved lower on heavy volume at the end of trading.
-- On each chart, the market tried to rally three separate times over the last two days but could not maintain upward momentum.
Simply put, these are very bearish charts.
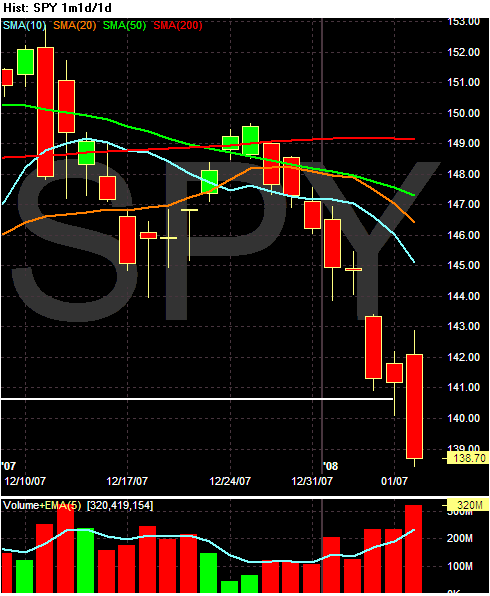
On the SPYs daily chart we have
-- 7 red bars in the last 8 days
-- A clear downward trajectory
-- increasing volume on the sell-off
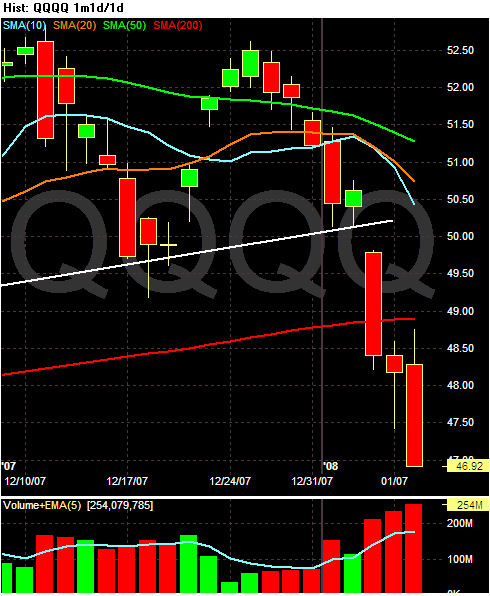
On the QQQQs we have
-- 7 of 8 red bars over the last 8 days
-- A clear downward trajectory
-- Increasing volume on the sell-off
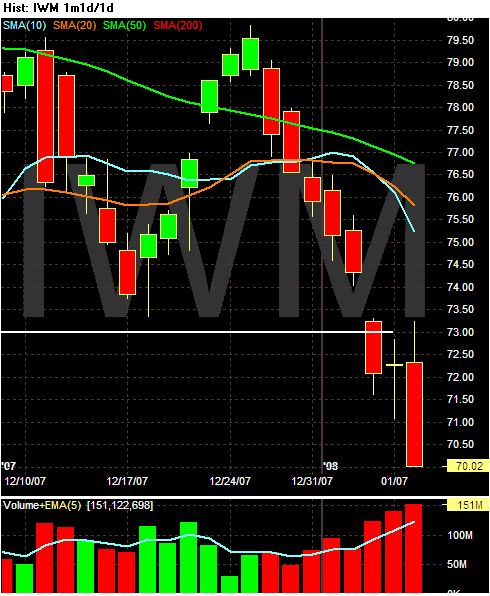
On the IWMs we have
-- 7 of 8 red bars over the last 8 days
-- A clear downward trajectory
-- Increasing volume on the sell-off
Short version: The markets are in heavy sell mode right now. And the increasing volume indicates that sentiment is increasing.