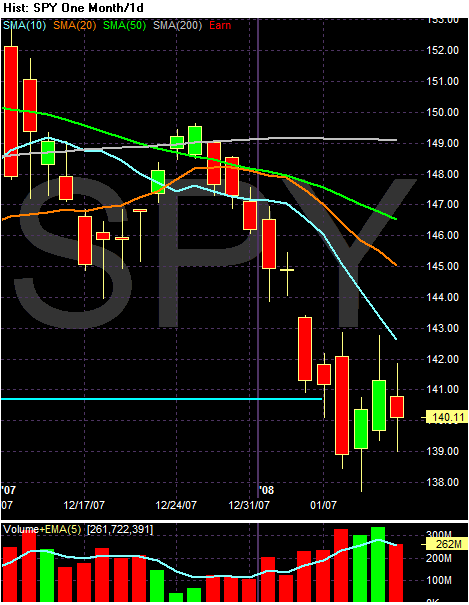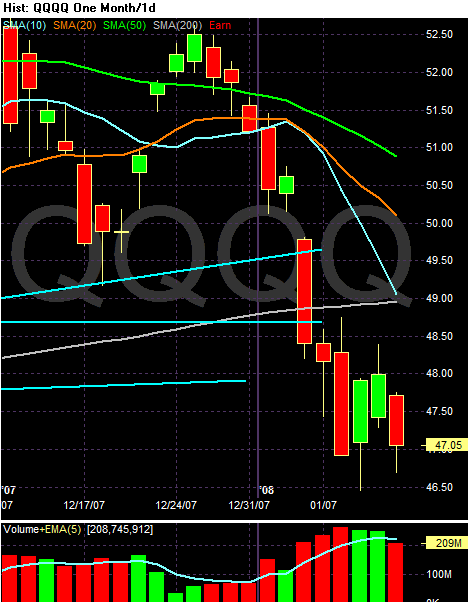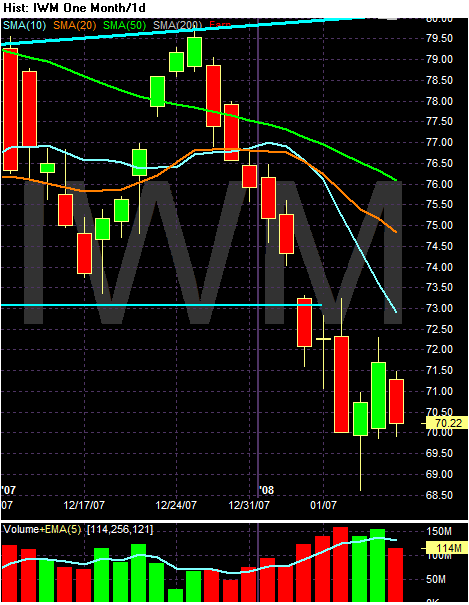


All three charts show a clear triangle/rectangle consolidation.
However, let's add one complicating factor.

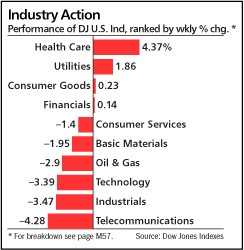
Money is clearly moving into conservative areas of the market. That means traders are getting more and more concerned about the underlying economic fundamentals.
Finally, here is a link to a piece I wrote on Thursday about my theory of the market. Basically, the market is already in a correction and is in the middle of a lower low/lower high move.