On November 22 of last year I first posed the idea that a bear market was forming. Here were the main points.
-- The Russell 2000 had already broken through 4-year support
-- Money was flowing into the Treasury market
-- Market breadth was declining
-- The Transportation Average was declining
Since I wrote that article, the points above have worsened and other averages have seen further deterioration
The Russell 2000
More than the established companies of the S&P 100, Russell 2000 companies are almost purely growth plays. As such, I use this index as a proxy for trader's overall risk appetite.
The chart which first got my attention is the 5 year IWM chart.
Notice the Russell 2000 has broken a four year uptrend. This is not a good sign.
Now, let's look at two shorter term charts.
I have circled the area where the Russell 2000 was when I wrote my first article. Since then, notice that while the index is more or less in the same place price-wise, it was twice risen to the lower trend line and fallen back. In other words, the index's previous support level is now resistance to upward price moves. Additionally, notice the Friday's price action gapped down with a strong downward candle on high volume. All of these developments are bearish for the index and represent a further deterioration of the technical nature of the Russell 2000.
Finally, here is the simple moving average picture of the IWMs:
Notice:
-- The index is below the 200 day simple moving average (SMA)
-- Prices are below all the SMAs, which will pull the SMAs lower
-- The shorter SMAs are below the longer SMAs
-- The 50 and 200 day SMAs are moving lower.
The Treasury Market
Prices for Treasuries are more or less where they were in late November. Prices had a sell-off and have since rallied. However, notice that the short, medium and long end of the Treasury market are still technically in a rally as they have all bounced off their respective trend lines.
1-3 year
7-10 year
20+ year
The Treasury market is caught between some strong conflicting trends right now. On one hand, they are a safe haven investment and benefit from trader's concerns about the markets. This is the main reason Treasuries are still rallying. On the other hand, with inflation rising trader's should be selling Treasuries. In addition, Treasuries are hemmed in by yield -- at some point, trader's won't perceive the yield they are getting as sufficient compensation for their investment. However, right now the safe haven argument is clearly the dominant force in the Treasury market.
Market Breadth
Market Breadth has worsened since the end of November
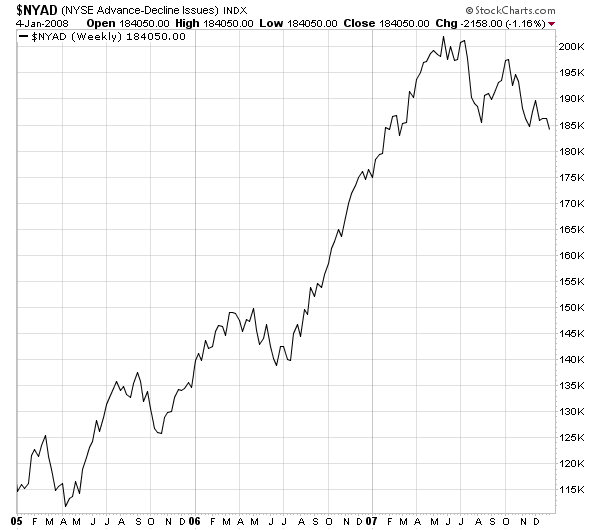
While the New York Advance Decline line is about where it was....
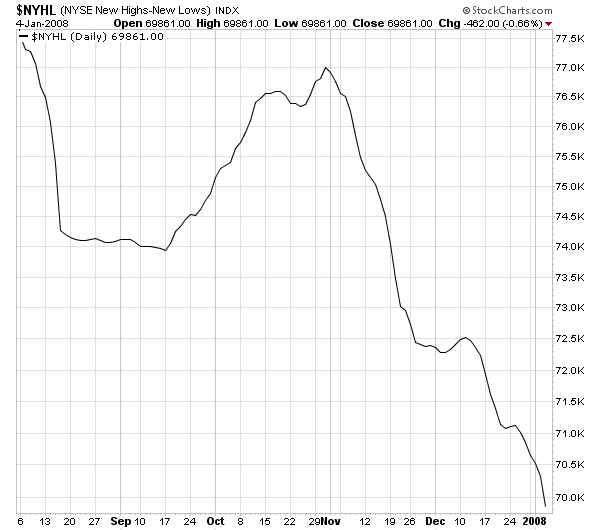
The new high/new low line has decreased indicating more issues are making new lows then new highs.
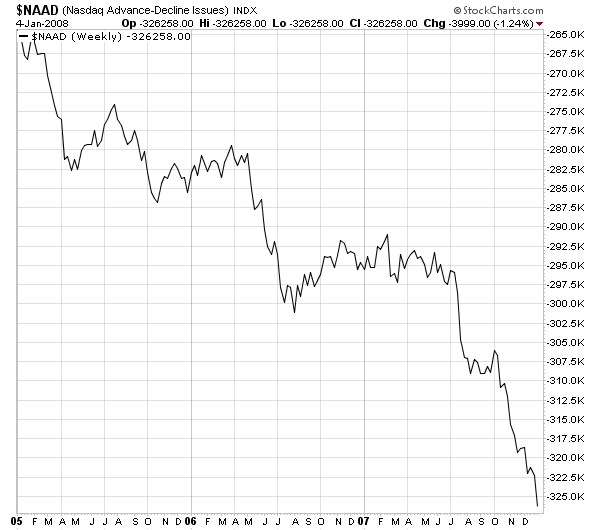
And the NASDAQ advance decline line has decreased...
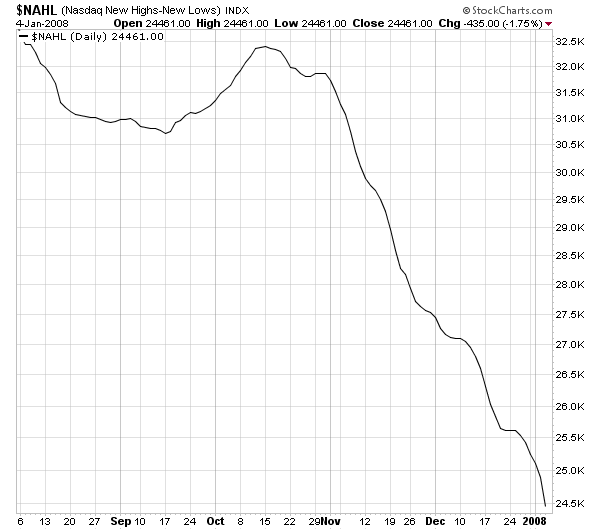
As has the NASDAQ new high/new low.
In short, market breadth is deteriorating. Fewer issues are advancing or more issues are declining and more issues are making new lows rather than new highs. None of these developments are positive. Also note the deteriorating NASDAQ situation; this market has been the market darling for the last few months, largely because it was tech rather than real estate oriented.
The Transportation Average
Dow theory is deceptively simple. It says the transportation average must confirm the broader trend in order for a rally to be a real rally. The underlying logic is simple. If the market is rising because the economy is expanding, then businesses will have to ship more stuff to various place. The opposite is also true; a slowing economy ships less stuff.
Here is a 5-year chart of the transports:
Notice the index has clearly broken a 4-year uptrend.
While prices are still about where they were in late November, notice that prices attempted to rally through the previous trend line only to be rebuffed from that level. In other words, support has become resistance. This is the same situation that happened with the Russell 2000, and as with the situation there, this is a bear market development.
And the SMA picture is not any better:
Note the following:
-- Prices are below the 200 day SMA
-- The shorter SMAs are below the longer SMAs
-- All the SMAs are headed lower
-- Prices are below the SMAs
Short version: this chart says "sell me".
So to review the points I made at the end of November:
-- The technical situation for the Russell 2000 has deteriorated as the market attempted to rally through previous support, only to be rebuffed twice
-- the Treasury market is still rallying
-- Market Breadth as deteriorated
-- The Transports have deteriorated as well.
So, let's add two more developments.
The SPYs
First, here is a 5-year weekly chart of the SPYs
The SPYs have two trend lines, one of which is important to this analysis. This is the upward sloping trend line which acted as the upper trend line to the SPYs trading channel that started in 2004. Note that prices moved through this support line last week. Prices have moved below this line before and rebounded, so there is always the possibility this will happen again. But the move should get some attention.
Note the SPYs have formed a diamond top. Depending on where you draw the lines that outline this formation the index has either broken through this pattern's lower lines or is about to. However, the diamond top is a reversal formation and indicates the market is topping. Considering the rather negative overall economic situation, this analysis makes sense.
The SMA analysis of the SPYs is very bearish. Notice:
-- Prices are below the 200 day SMA
-- Prices are below all the SMAs
-- The shorter SMAs are below the longer SMAs
-- The 10, 20 and 50 day SMAs are heading lower
The QQQQs
The QQQQs were supposed to be the market's savior; they weren't exposed to real estate in the same proportion as the SPYs. However, they too have started to falter.
On the 5 year chart, notice there are several important trend lines. Last week, the QQQQs fell through the trend line established two years ago. Now, the QQQQs still have strong support from the two other trend lines of the channel started in 2004, so all hope is far from lost.
On the 6 month chart, notice the convincing way the QQQQs moved through support -- with a strong downward bar on heavy volume. This is not a good sign.
The QQQQs moving average picture is deteriorating. Note the following:
-- Prices moved below the 200 day SMA last week
-- The 50 day SMA is heading lower
-- Prices are below the SMAs which will pull the SMAs lower
However, this is still the strongest of the averages and could rebound. But the deteriorating breadth (see above) makes this an unlikely possibility.
The Declining Dollar, Rising Commodities and a Hemmed In Fed
There is more talk now of a 50 basis point rate cut by the Fed. However, can they really make a move that aggressive right now? Let's assume they do cut by 50 basis points. That will hit the dollar hard, which is already dropping:
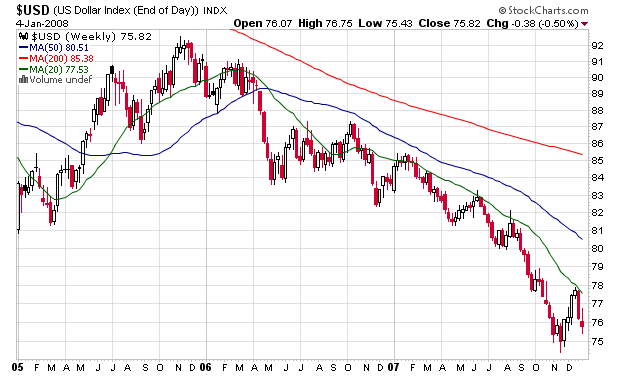
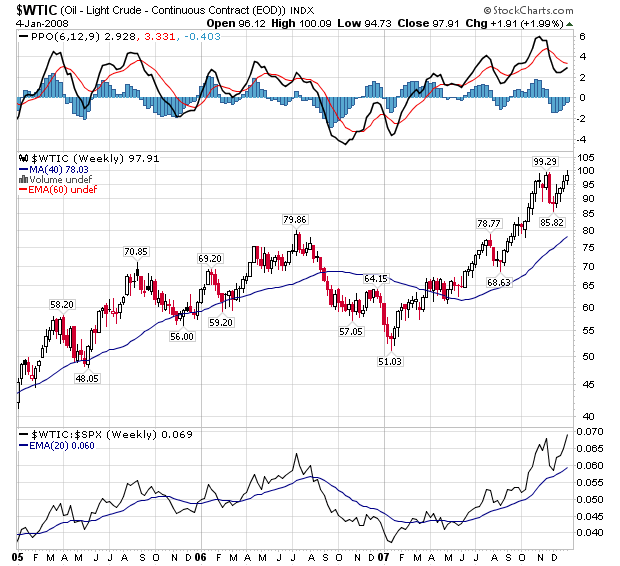
And the dropping dollar has helped to spike commodity prices. Because most commodities are priced in dollars, a drop in the dollar's value is a de facto increase in these commodities' respective prices. As a result, we have seen oil increase
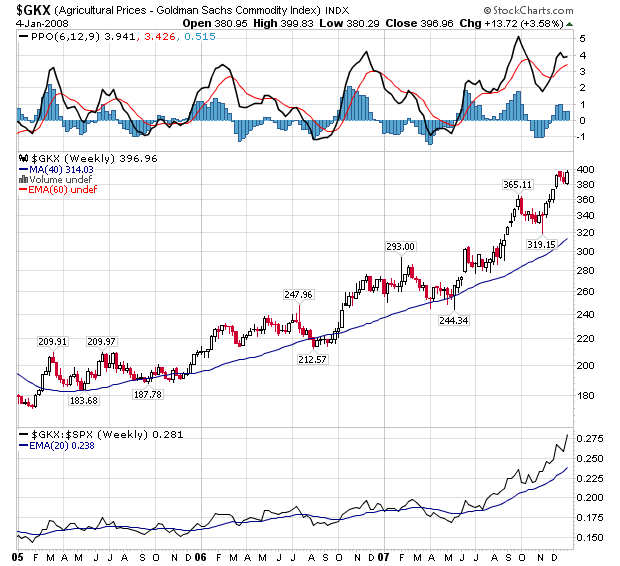
As well as agricultural prices
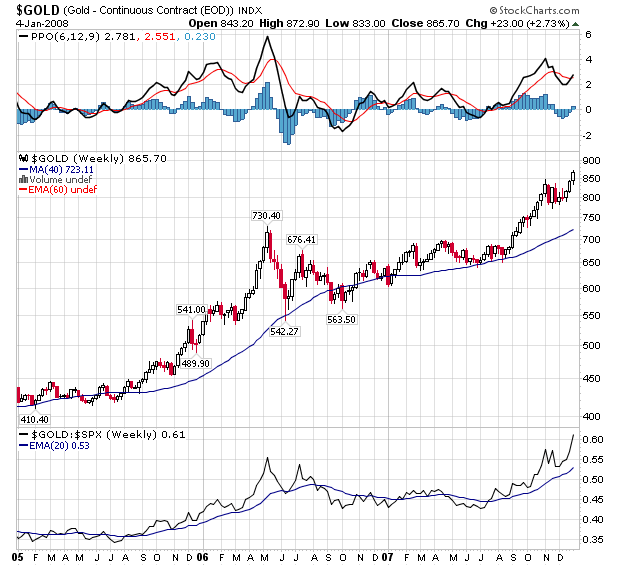
And investors are clearly worried about inflation as indicated by gold's price spikes:
In short, how much can the Fed really do right now? I will be the first to admit I have been seriously wrong about the Fed. Before their last meeting, several members made pretty dovish statements only to lower rates by 25 basis points. So reading too much into their public statements is not a wise idea. However, at their last meeting they lowered rates 25 basis points, which disappointed a market expecting 50. In addition, the Fed began a big liquidity injection, which I think they did as a result of inflationary pressures hemming them in from an interest rate policy perspective.
To sum up since the end of November --
-- The Russell 2000 has deteriorated
-- The Transports have deteriorated
-- Market Breadth has deteriorated
-- Treasuries continue to rally
In addition, last week
-- The SPYs have broken through support
-- the QQQQs have broken through support
And finally
-- A weakened dollar is spiking commodity prices, hemming the Fed in from a policy perspective.
In other words -- the problems in the market are spreading to other indexes and the Federal Reserve is facing an incredibly difficult policy situation.