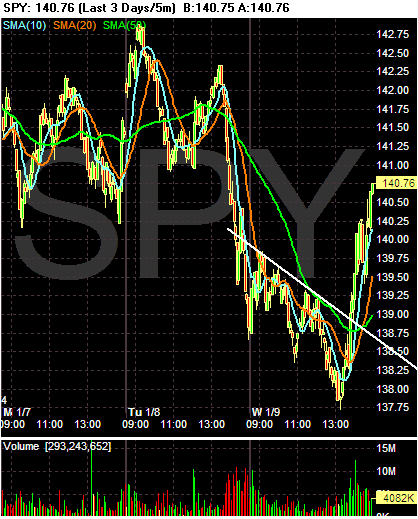
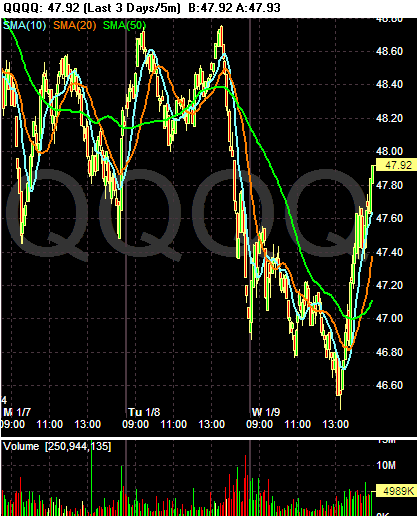
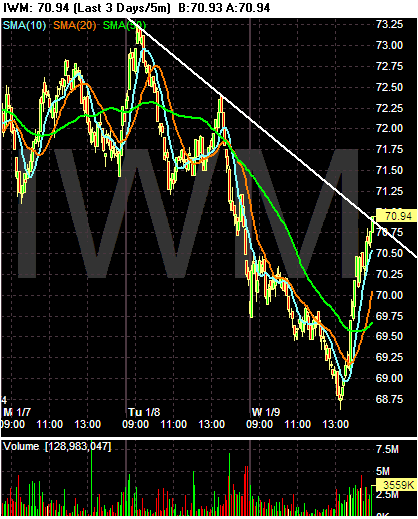
All of the chart have the same pattern. In the early afternoon, they broke through resistance on heavy volume and closed at the high point of the day. In addition:
There is not a specific headline that accounts for the spike, but there is strength in some of the bigger financial names, including Merrill Lynch (MER 59.73, +1.56) and Morgan Stanley (MS 47.32, +1.19).
In other words, this looks and feels like a purely technical bounce as opposed to a fundamental news driven event.
However, let's pull the lens back and look at the trading so far this year.
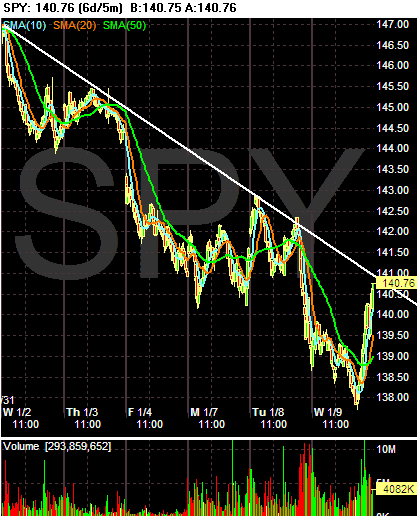
The SPYs are still clearly in a downward moving pattern, although a strong opening tomorrow with follow-through during the trading session would reverse that trend. Also note there really isn't a strong reversal formation on this chart. There is a possible "V" bottom but that could also simply be a lower lower in the pattern of moving lower.
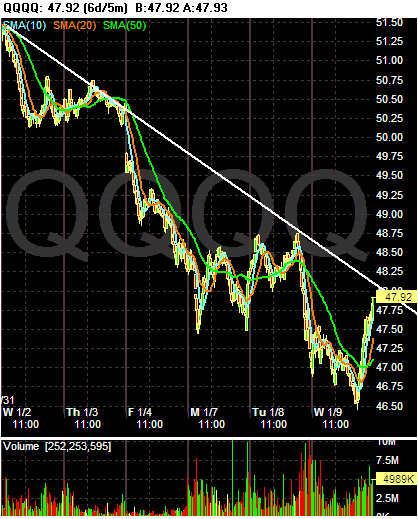
As with the SPYs, the QQQQs are still in a downtrend as well. In addition, aside from a possible "V" bottom, there isn't a clear reversal formation.
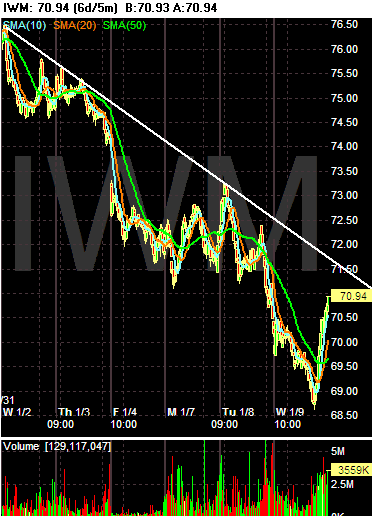
Ditto.
It's been a terrible start to the year for the indexes. With more firms making recession predictions and more and more investors expressing concerns about the soundness of the economy I wouldn't expect that trend to stop. But I could be wrong.