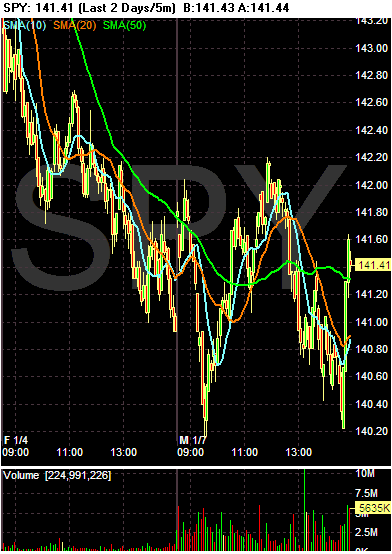
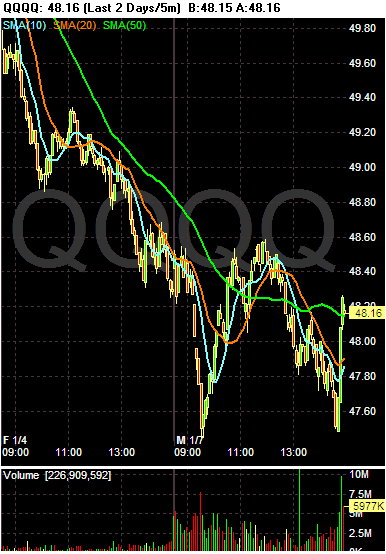
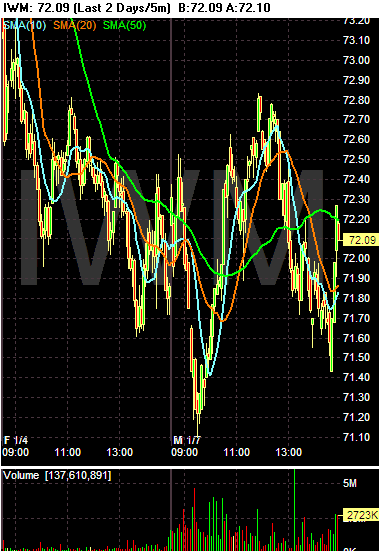
However -- that's not what's important right now. The daily charts all show indexes that have sustained pretty heavy technical damage.
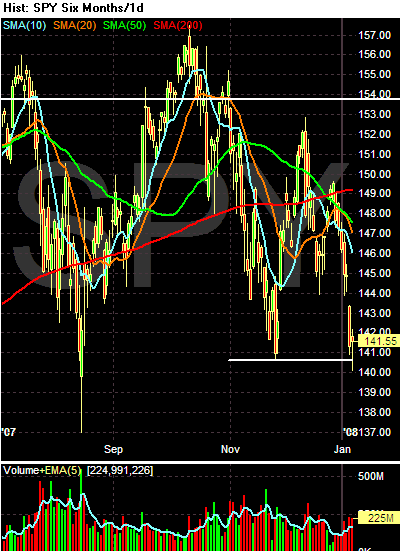
On the SPYs, notice
-- The heavy selling over the last two days
-- the gap down on Friday
-- The fact that prices are near some of the lowest levels over the last three months.
-- Prices are below all the SMAs
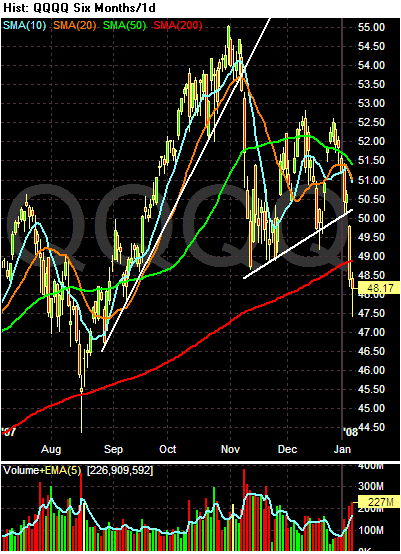
On the QQQQs notice:
-- Prices broke the two month uptrend on Friday
-- Prices gapped down and continued lower
-- Prices are below the 200 day SMA on heavy volume
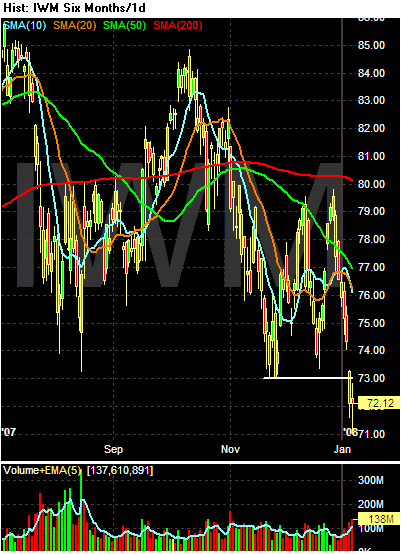
The IWMs are
-- Below their 200 day SMA
-- Are at their lowest point of the last 6 months
-- Gapped down on heavy volume
None of these daily charts bodes well for the future.