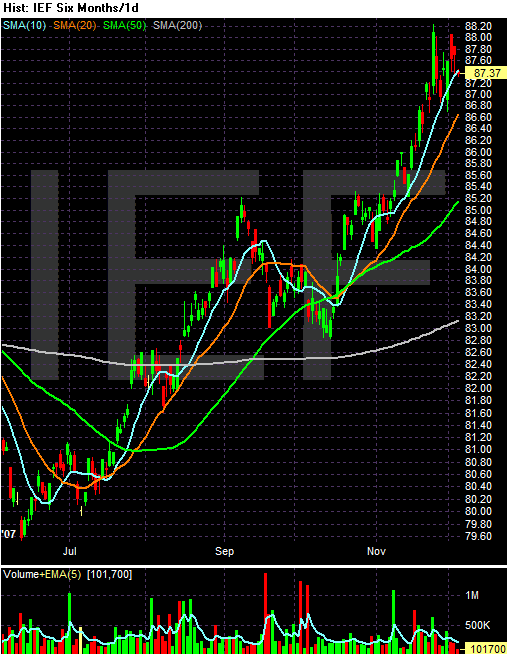
The Treasury market has been in a strong rally since early July. The primary reason for this rally is concern in the credit markets. Because Treasuries are considered the safest investments around, investors will flock to them when they are concerned about something in the economy. The credit crunch has obviously spooked investors, sending them flocking to Treasuries for the last 5 months.
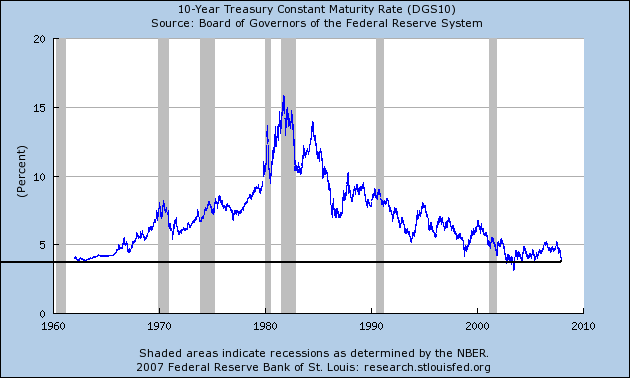
But how long can this rally continue? Unlike stocks which theoretically have unlimited upside potential, bonds are constrained by their interest rates. Here is 40 year chart of the interest rate on the 10-year constantly maturing treasury.

The chart is pretty clear. We're at historically low interest rates on the 10-year Treasury.
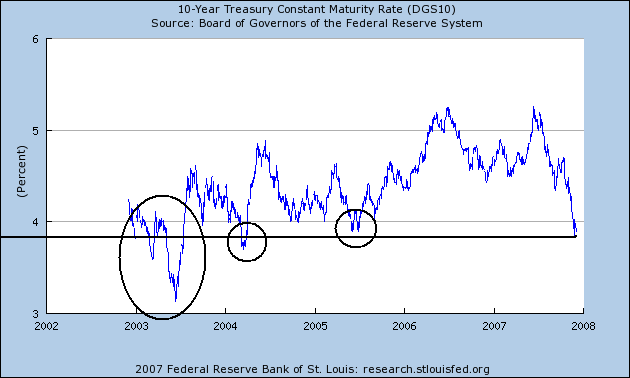
Here is a 5-year chart to better see recent movements.

I've circled the areas where the prevailing interest rate was at or below current levels. Notice we had an extended rally in early 2003 that drove rates to levels below the present level. We also had a brief rally in early 2004 that pushed levels to current levels. But referring to the above 40-year chart those are the only times in the last 40 years rates have been this low.
In the financial markets, anything is possible. And considering the current concern about the credit markets, it's possible we could see rates go lower. Just remember that hasn't happened that often. In fact, it's only happened twice in the last 40 years. So for the rally to continue, traders must be really concerned about the credit markets.