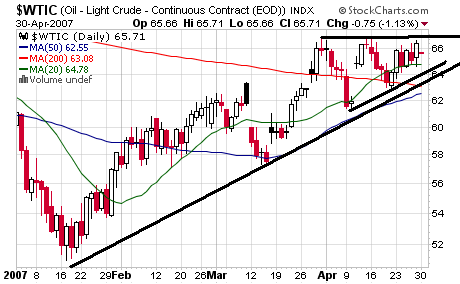
1.) The uptrend that started in mid-January is still firmly in place.
2.) There is a secondary uptrend in place that started in early April.
3.) There is an ascending triangle pattern that started in early April. These are considered bullish chart patterns because the market continually makes higher lows, indicating traders think the lowest price for the commodity is increasing.
4.) The 20-Day SMA is rising, which is puling the 50-day SMA higher.
5.) Prices are over the 20 and 50 day SMA, which will continue to pull these averages higher.
6.) Prices have been bouncing off the SMA, using the SMAs as support.
7.) Remember the fundamental picture is still bullish. OPEC has reduced production, the US entering the summer driving season and China and India are still growing at high rates.