Monday, April 30, 2007
A Deeper Look At Consumer Spending
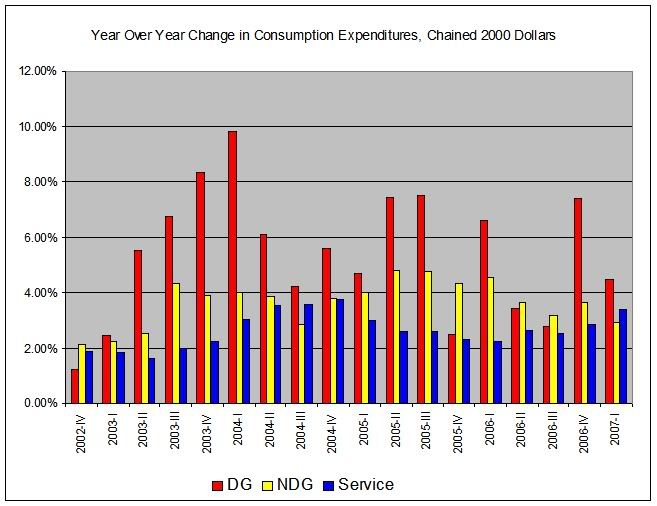
Here is a graph of the year-over-year percent change in consumer spending in chained 2000 dollars. DG = Durable Goods, NDG = Non-Durable Goods and Service = service (duh). Pay particular attention to the first two areas of change. They represent the first year over year levels of consumption expenditures coming out of a recession. Here is the point of this graph. Consumption expenditures are still strong on a year-over-year basis. Until we start seeing YOY comparisons like those in the first few quarters after the recession the economy should be doing OK.