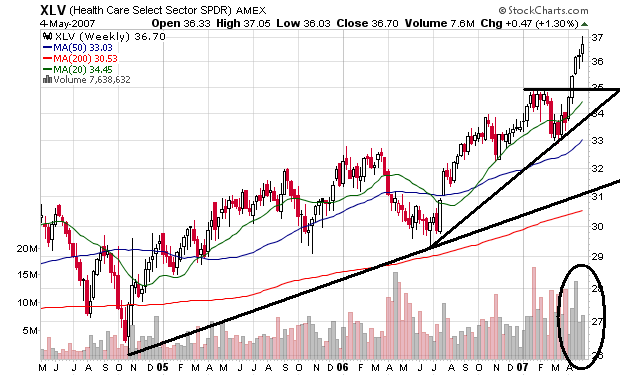
Two charts indicate this may be happening. Here is a chart of the health care ETF. The chart has enjoyed a slightly upward moving rally since late 2005. Recently the ETF has broken through resistance just below 35 on a good volume spike.
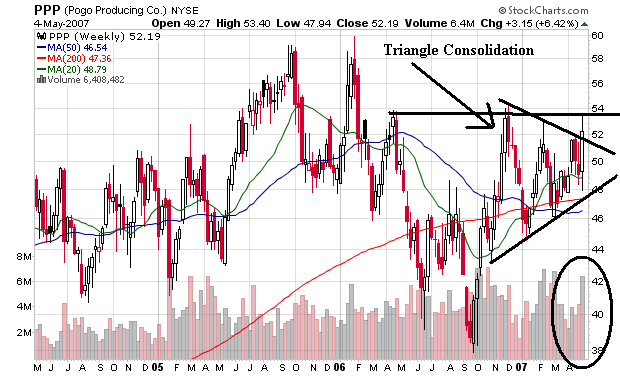
Here is a chart of the big-Pharma ETF, PPP. This chart has a classic triangle consolidation and has broken out of the pattern on good volume as well. This chart still has a major point of resistance just a bit below 54.