Wednesday, December 17, 2008

A Little Humor Break

This has been mentioned several times in "quotes of the year" retrospectives:

10. (tie) "Anyone who says we're in a recession, or heading into one — especially the worst one since the Great Depression — is making up his own private definition of "`recession.'" — commentator Donald Luskin, the day before Lehman Brothers filed for bankruptcy, The Washington Post, Sept. 14.


Personally, I've been laughing about this ever since someone pointed it out sometime over the last few weeks. This guy is a moron of the highest order; why anyone would listen to him -- let alone spew his stupidity -- is beyond me.

Comparisons To Other Recessions

I've been meaning to link to this for some time but it has slipped my mind. Macroblog ran a set of employment data comparing the current recession to other recessions. Here is their conclusion:

One way to look at this is to examine the trajectory of employment relative to December 2007 levels (when this recession began) and compare it with the average trajectory of relative employment in other recessions:

.....

A more apt comparison might therefore be the “bad” recessions of recent memory, the 1973–75 and 1981–82 episodes, which both lasted sixteen months.

Here, for your viewing displeasure, are those comparisons:

.....

The trajectories suggested by the relatively long-lived, more severe recessions of 1973-75 and 1981-82 are almost certainly more sensible comparisons at this point. And, as bad as it is right now, we are still a fair distance from the pace of relative employment losses in those episodes.


This is an interesting observation and it helps to put the current situation in historical perspective. Let me add my own theory.

I think that what is happening in the 4Q of 2008 and the 1Q of 2009 will be the "tear the band-aid off quickly to get it over with" wave of layoffs. Here is a graph of job creation for the last 10 years:


Click for a larger image

The best read of job creation for the latest expansion is 8.2 million jobs (from 129,822,000 in August 2003 to 138,078,000 in December 2007). This figure alone is very important. It tells us that job creation was low. Why? My personal thesis is that companies have become incredibly streamlined over the last 30 years; in general they now only hire when it is absolutely essential. As a result total job creation is decreasing for expansions. This is the natural result of the productivity increase we have seen over the same time.

So far this year we've lost 1.9 million jobs or 23% if all jobs created during the latest expansion. The worst rate of job losses for a recession over the last 60 years is about 50% in a recession that occurred in the 1950s. So, we're about halfway there. For the US to get to the 50% mark we need to lost about another 2.1 million jobs. Assuming a 250,000 - 500,000 rate per month, that means we have about another 3-6 months of ugly job losses to go.

After that my hope is we see a big fiscal package approved to start pumping money into the economy. This will make the 4th quarter a fair but not great half year.

I could be wrong in all of this. The economy likes to make an ass out of economists -- and actually does so with alarming frequency.

On the Madoff Situation

I haven't written anything about the Madoff scheme yet. There have been so many economic events to keep up with that it can be a bit like trying to plug holes in a dike. However, here are some points.

1.) This is crap. According to the SEC:

The Commission has learned that credible and specific allegations regarding Mr. Madoff’s financial wrongdoing, going back to at least 1999, were repeatedly brought to the attention of SEC staff, but were never recommended to the Commission for action. I am gravely concerned by the apparent multiple failures over at least a decade to thoroughly investigate these allegations or at any point to seek formal authority to pursue them. Moreover, a consequence of the failure to seek a formal order of investigation from the Commission is that subpoena power was not used to obtain information, but rather the staff relied upon information voluntarily produced by Mr. Madoff and his firm.


Yet they did nothing. As per the usual course over the last 10+ years, regulations were not enforced. In fact, it's as though there were no regulations in effect. Meaning -- what is the actual purpose of the SEC when a $50 billion dollar scheme can go unnoticed for this long? Does everyone just go to the office and play cards all day long?

2.) There is no way this is a solo job. Again from the SEC

SEC investigators are currently working with the trustee and other law enforcement agencies to review vast amounts of records and information involving Mr. Madoff and his firm. Those records are increasingly exposing the complicated steps that Mr. Madoff took to deceive investors, the public and regulators. Although the information I can share regarding an ongoing investigation is limited, progress to date indicates that Mr. Madoff kept several sets of books and false documents, and provided false information involving his advisory activities to investors and to regulators.


The steps Madoff employed were "complicated". There were "several sets of books and false documents." Bottom line -- my guess is his whole firm is involved. Again -- where in the hell were the regulators?

Yesterday on CNBC there was an interview with a defrauded couple. They received monthly statements that showed transactions in individual stocks. They weren't the only people who received this information -- my guess is everybody did. That means the degree of sophistication involved is huge. Again Ii return to my thesis -- everybody at his firm is suspect.

This is a disaster. It indicates how far we have come from the idea of having a regulatory authority overseeing the market to insure the market is honest, fair and provides level playing field. We need to get back to that place. Now.

Wednesday Commodity Round-Up

Click for larger image

Notice the following on the weekly chart:

-- Prices are at or near their lowest point in over three years

-- Prices have taken a nosedive over the last 5 months

-- The shorter SMAs are below the longer SMAs

-- All the SMAs are moving lower

-- Prices are below all the SMAs

BUT

-- The MACD is oversold

-- The RSI is oversold big time


Click for a larger image

Notice the following on the daily chart:

-- Prices have continually moved lower over the last 5 months

-- All the SMAs are moving lower

-- The shorter SMAs are below the longer SMAs

-- Prices have continually used the 20 day SMA as upside resistance over the last 4 months and are doing so now.

BUT

-- The MACD has been rising for the last month and a half and

Bottom line: this is an index that wants to rally. The weekly RSI and MACD and the daily MACD are all signaling an oversold condition. But, right now there is no fundamental catalyst. The OPEC announcement might help, but we will have to wait and see.

Tuesday, December 16, 2008

Today's Market

WOW -- important technical news today

Photobucket

Note the SPYs are now trading above the 50 day SMA. That's very important news -- it indicates the rally is gaining strength.

The Fed's New Strategy: The Kitchen Sink Interest Rate Policy

The Fed announced their policy of establishing "a target range for the federal funds rate of 0 to 1/4 percent."

This brings two points to mind:

1.) The Fed has no interest rate moves left. This is it.

2.) The Fed is terrified about the economy. And they have good reason:

Since the Committee's last meeting, labor market conditions have deteriorated, and the available data indicate that consumer spending, business investment, and industrial production have declined. Financial markets remain quite strained and credit conditions tight. Overall, the outlook for economic activity has weakened further.


Let's look at the charts:

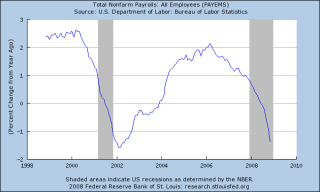
Photobucket

Employment has taken a nosedive. As a result:

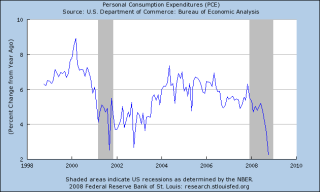
Photobucket

People have cut way back on their spending. As a result:

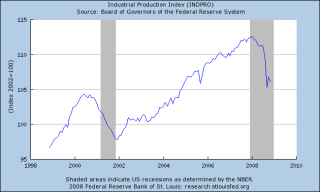
Photobucket

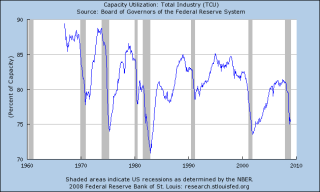
Industrial production is dropping and so is:

Photobucket

Capacity Utilization -- the amount we are using of our manufacturing capacity.

More to the point, the Fed will step up their other activities:

The focus of the Committee's policy going forward will be to support the functioning of financial markets and stimulate the economy through open market operations and other measures that sustain the size of the Federal Reserve's balance sheet at a high level. As previously announced, over the next few quarters the Federal Reserve will purchase large quantities of agency debt and mortgage-backed securities to provide support to the mortgage and housing markets, and it stands ready to expand its purchases of agency debt and mortgage-backed securities as conditions warrant. The Committee is also evaluating the potential benefits of purchasing longer-term Treasury securities. Early next year, the Federal Reserve will also implement the Term Asset-Backed Securities Loan Facility to facilitate the extension of credit to households and small businesses. The Federal Reserve will continue to consider ways of using its balance sheet to further support credit markets and economic activity.


To the point: the Fed is scared right now. I mean really scared. And they will do anything even remotely possible right now.

Federal Reserve Lido


Click for a larger image

How low can they go?

So Much for Inflation

From the BLS:

The Producer Price Index for Finished Goods fell 2.2 percent in November, seasonally adjusted, the Bureau of Labor Statistics of the U.S. Department of Labor reported today. This decline followed decreases of 2.8 percent in October and 0.4 percent in September. At the earlier stages of processing, prices received by manufacturers of intermediate goods dropped 4.3 percent in November after falling 3.9 percent in the prior month, and the crude goods index declined 12.5 percent subsequent to an 18.6-percent decrease in October.


Here's the relevant YOY PPI chart:


Click for a larger image

Also from the BLS:

The Consumer Price Index for All Urban Consumers (CPI-U) decreased 1.9 percent in November, before seasonal adjustment, the Bureau of Labor Statistics of the U.S. Department of Labor reported today. The November level of 212.425 (1982-84=100) was 1.1 percent higher than in November 2007.


Here's the relevant year over year chart:


Click for a larger image

When looking at these charts it's important to remember the impact of the CRB index which has been crashing hard:


Click for a larger image

This in turn is caused (at least partially) by the rallying dollar:


Click for larger image

Notice how the dollar's rally and the CRB's drop occurred at about the same time.

The bottom line is inflation is no longer an issue. It also means a period of deflation is possible. What fun.

Treasury Tuesdays

Are we in a Treasury market bubble? Some people think so:

In the wake of popped stock, housing and commodity bubbles, some see a fourth bubble building -- in Treasury bonds. Unlike those bubbles, this one doesn't have to end disastrously.

Treasury yields, which move inversely to prices, are at historic lows. Friday, the yield on the 10-year note fell to 2.47%, the lowest in Federal Reserve records going back to 1962 and well below the average of the past decade of about 4.7%.

Treasurys have been rare good investments in this awful year, returning 10% through November, according to Merrill Lynch chief North American economist David Rosenberg, a longtime bond bull. But even he recently told clients that Treasurys were "clearly heading into a bubble phase" and suggested there might be greener pastures in other fixed-income investments, such as debt backed by government-sponsored entities.

Meanwhile, the U.S. government may post a trillion-dollar budget deficit in the fiscal year ending in September and has pounding fiscal headaches looming far beyond that. Some key buyers of its debt, foreign central banks, are launching their own expensive stimulus packages and would seemingly have better uses for their cash.

And while the U.S. government's access to cheap money helps its efforts to stimulate the economy, it also may crowd out other borrowers. Municipalities and companies with good credit histories are paying exorbitant rates to borrow, arguably extending the pain of the credit crunch.

"We have a remarkable situation in which a 30-year loan to the U.S. government with a taxable instrument pays you 3% and a loan to the state of Ohio pays you 5% tax-free," said David Kotok, president of money-management firm Cumberland Advisors in Vineland, N.J.


A few weeks ago I noted that yields would probably provide some upside resistance for bonds. Remember prices and yields move inversely; as bonds prices rise yields fall. At some point, investors just aren't being compensated for the time risk they are taking (as in lending money for a long period of time).

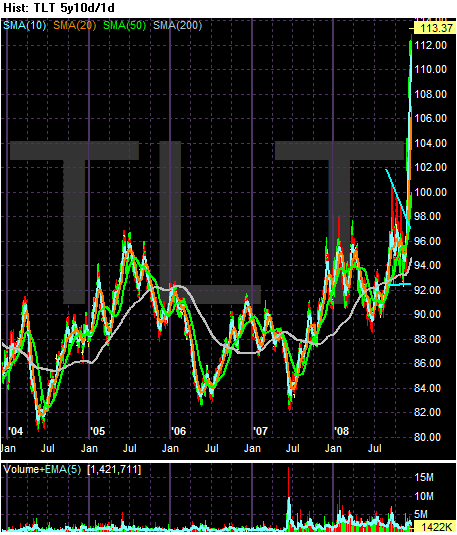
Unfortunately, this did not take into effect the credit crunch. Right now people are not thinking about return on capital; they are thinking about return of capital. As a result government bonds look pretty good. But take a look at the charts:

Photobucket

Above is a 5-year chart of the TLTs -- the ETF that tracks the long end of the Treasury curve. Prices remained in an 82 - 96 range for three and a half years from 2005 until the 4Q of 2008. Before that they were trading cheaper. Now take a look -- prices are spiking into record high territory.

Here is a chart of the 30-year yield. Remember the 30 year bond was retired for several years at the beginning of this decade:


Click for a larger image

Yields are now the lowest they have been in over 30 years.

Photobucket

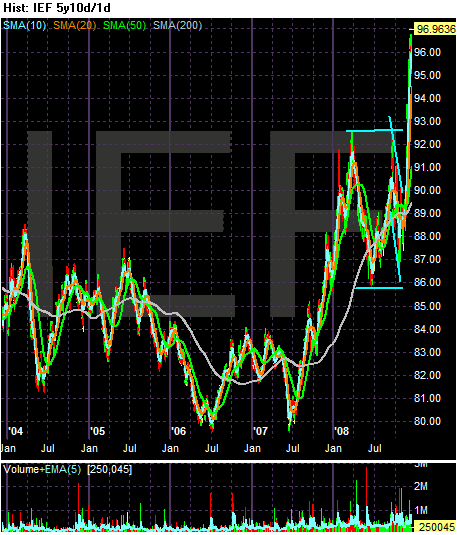
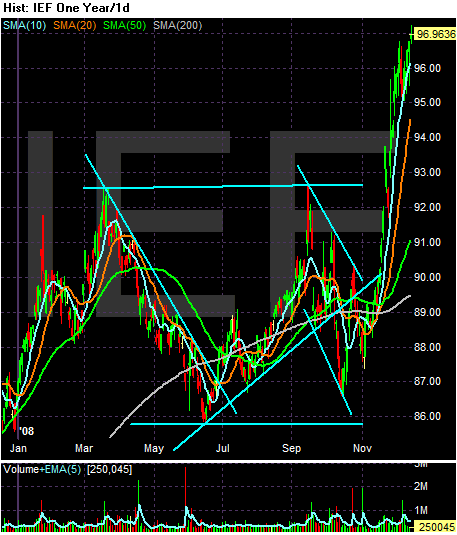
Above is a 5-year chart of the IEFS -- the ETF that tracks the 7-10 year Treasury market. Notice that prices are at record highs. Earlier this year I commented that Treasuries (specifically the IEFs) may be forming a double top, which is better illustrated by the following 1-year chart:

Photobucket

The first top occurred right after the first of March and the second top occurred right at the beginning of September. But notice that prices have moved right through the 92.5 area to make a new top. Here's a chart of the 10-year CMT Treasury's yield -- which moves inversely to price:


Click for a larger image

Again, notice that yields are at multi-decade lows.

Photobucket

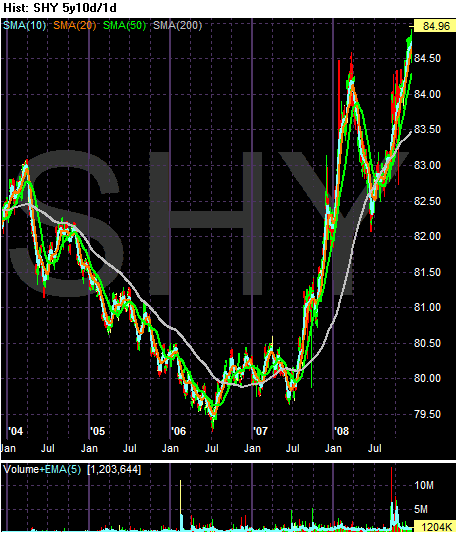
Above is a chart of the SHYs -- the short end of the Treasury curve. Again, notice the price spikes that have occurred in the latest rally.

All of the charts above are "bubble" charts -- prices have spiked to incredibly high levels largely based on panic and concern. Also consider the fiscal backdrop this is occurring in. There are talks of the new administration implementing a $1 trillion spending program over 2 years. That means record deficits. As a result the Treasury will need to borrow big. Increased supply = lower price = higher yield. At least that's what traditional market thinking would lead to.

Monday, December 15, 2008

Today's Market

Photobucket

Most of my thoughts on today's market were written in this morning's post. The central issue is technically the market wants to rebound -- the MACD and OBV are increasing and the market has shrugged off some very bad news. But so long as prices remain in a downward sloping channel I will be concerned.

Some Very Interesting Observations

The following is from a Barron's interview with Stephanie Pomboy:

What else do you see happening in the near term?

With the government guaranteeing all manner of private-credit claims, many investors may decide to get long "socialism," for lack of a better term. Or, as some euphemistically put it, this is partnering with the government. So in the short run, we could see a rally in risky assets and a selloff in Treasuries. But the economic deleveraging has barely begun, and that's my longer-term thesis. It all revolves around the idea that U.S. consumers are actually going to do the unthinkable -- they are going to save -- and that we will be more like Japan than anyone believes is possible.

Hence, consumption declines.

Right. Wages have been silently crowded out by benefits as a share of total compensation, as companies look to offset rising health-care costs. The result is that the share of income that consumers can actually spend is at its lowest in the post-war period. It had not been a problem, because consumers would just borrow to fill that gap. But now, they don't have appreciating assets against which to borrow. So while we could get a rally in risk assets -- including high-yield debt -- it's likely to be a short-term rally within a context of a secular bear market.


I have not seen this idea/concept phrased as well. Wages -- the actual dollars that people spend -- have been crowded out by benefits -- as in medical insurance. In other words, the raise that people thought they were getting in their overall compensation in fact went to something they could only spend on one thing -- namely health care. As a result, people have to borrow to buy other stuff. Hence we have seen the following events.

Consumer debt has been increasing:


Click for a larger image

Savings has been decreasing:


Click for a larger image

Retail Sales Drop


Click for a larger image

Above is the chart from the Census Bureau's release. But, it's not as bad as thought:

With gasoline prices plunging and auto sales on life support, U.S. retail sales dropped 1.8% in November for their fifth straight decline, the Commerce Department reported Friday.

Retail sales -- which account for about a third of final demand -- were down 7.4% compared with a year earlier. In the past three months, sales have fallen 4.7% compared with the previous three months.

.....

But the extent of the decline was exaggerated by a historic drop in retail gasoline prices in November. Excluding the record 14.7% fall in sales at gas stations, retail sales fell just 0.2%.


This drop should not be surprising. The US is in a recession, consumer confidence is low and households are taking major hits to both their stock and real estate portfolios. To that end, notice this huge drop in household wealth from the just released Flow of Funds Report

There is also the possibility things aren't that bad when you take out autos and gas station sales:

However, excluding those two sectors and the weak building-materials industry, retail sales would have increased 0.5% for the month. With the economy losing half a million jobs in November, said J.P. Morgan Chase & Co. economist Michael Feroli, "the most plausible explanation for the increase...is that gasoline prices dropped a record 30% in the month, freeing up purchasing power for those lucky enough to keep their jobs."


The short version here is Christmas probably won't be as bad as people think. But that does not mean consumers are going to go all out either. In addition, my guess is that after the first of the year we're going to see big pull backs as people hunker down for the next few months to see what the new administration does and whether or not it helps.

Market Monday's

I'm back. Let's start the week off with a broad look at the markets.
Photobucket

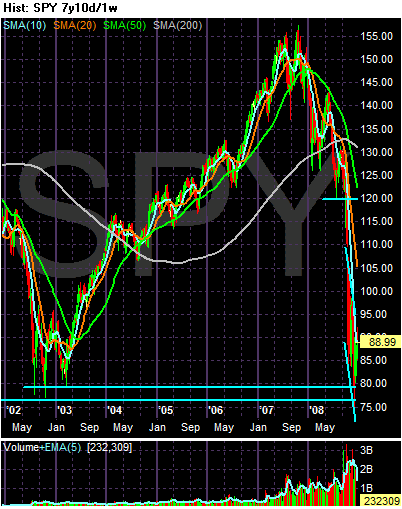
Let's start with a long-view. Above is a 7-year chart of the SPYs in weekly increments. Notice that all gains from the 2003-2007 rally are now gone. The market is trading at levels from the 2002-2003 consolidation.
Photobucket

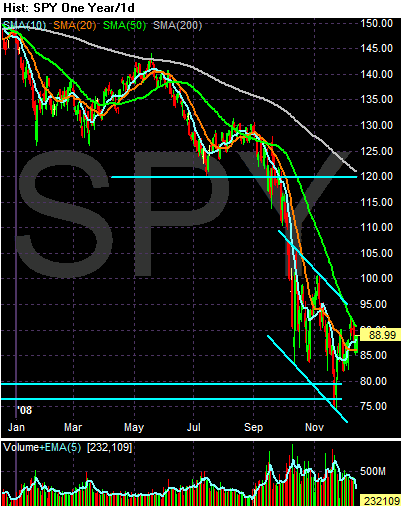
Above is a yearly chart in daily increments. Please note the following:

-- Once prices fell through the 120 level, they dropped hard and fast. They went to 90 (a 25% drop) within a month, and hit the 75 level (a 37.5% drop) wthin two months. Obviously 120 was an incredibly important level for traders

-- There was also a big volume spike on the sell-off indicating a lot of people were simply getting out.

-- The market is 25.84% below the 200 day SMA. In other words, we're clearly in a bear market
Photobucket

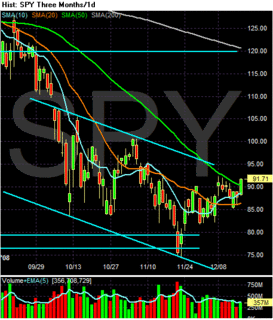
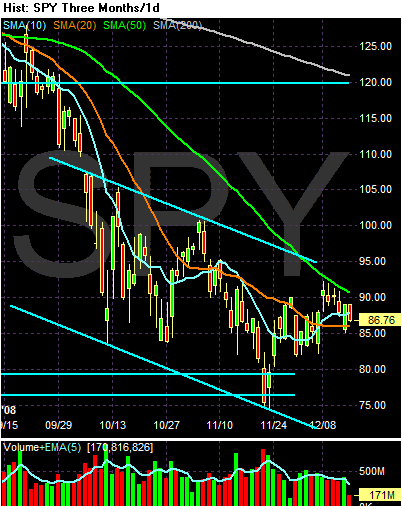
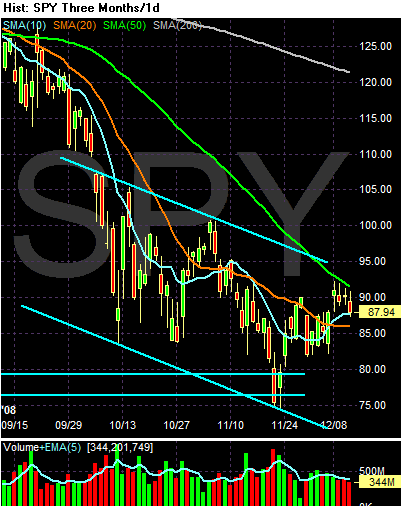
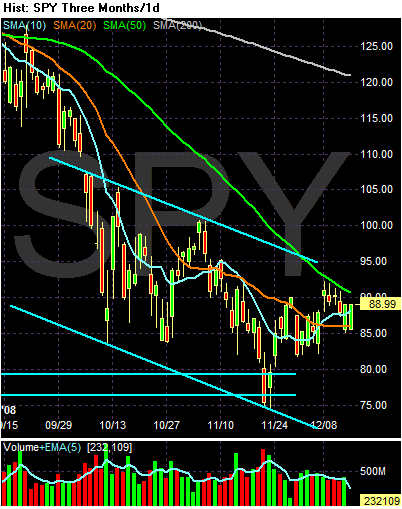
On the 3-month daily chart notice the following:

-- The 50 and 200 day SMA (longer term trends) are both moving lower

-- The 10 day SMA is rising and it has crossed the 20 day SMA

-- The 20 day SMA is neutral (moving sideways)

-- Prices rose to the 50 day SMA but couldn't get over the line. They retreated to the 20 day SMA and bounced higher

-- Prices are still in a downward sloping channel

-- Remember the bearishness of the news over the last few weeks. We've learned the nation as lost over 1 million jobs in the last three months. Retail sales were weak. The auto industry is in deep trouble. If it falls the unemployment situation would worsen fast. And yet, the market has not cratered as bad as possible.

Let's add a few more charts.
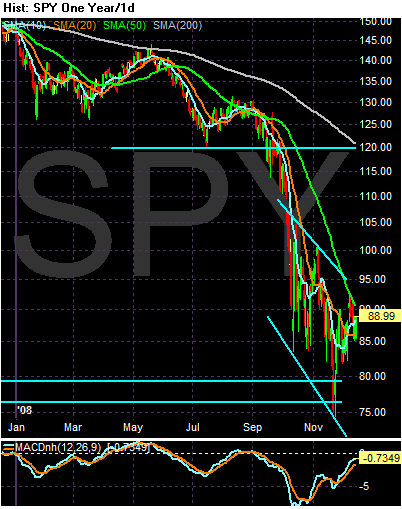
Photobucket

The MACD has been rising for the last two months indicating momentum is changing
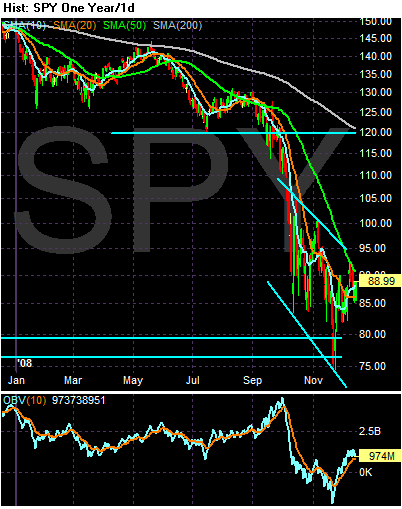
Photobucket

As has the On Balance Volume. This tells us that money is flowing into the market

Let's add a few more charts to complete the picture
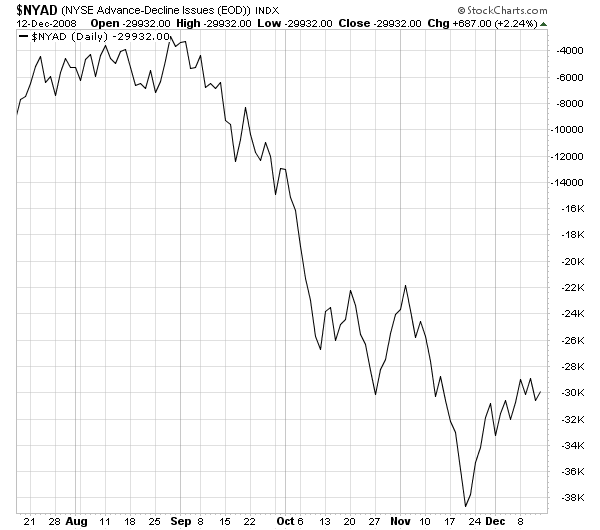
Photobucket

The NY Advance/Decline line is rising
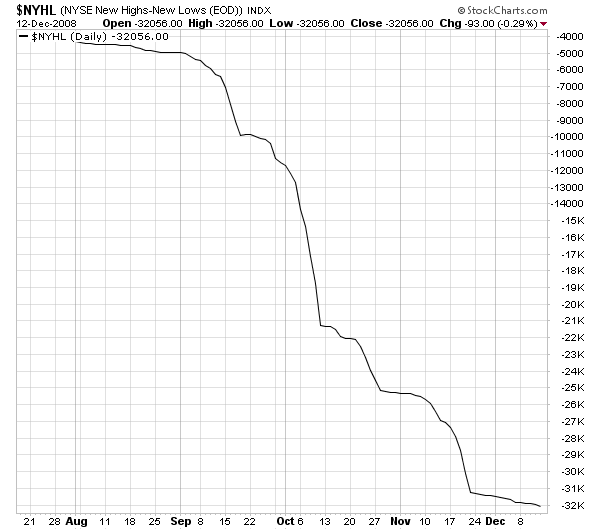
Photobucket

And the downward slope of the NY new high/new low line is lessening
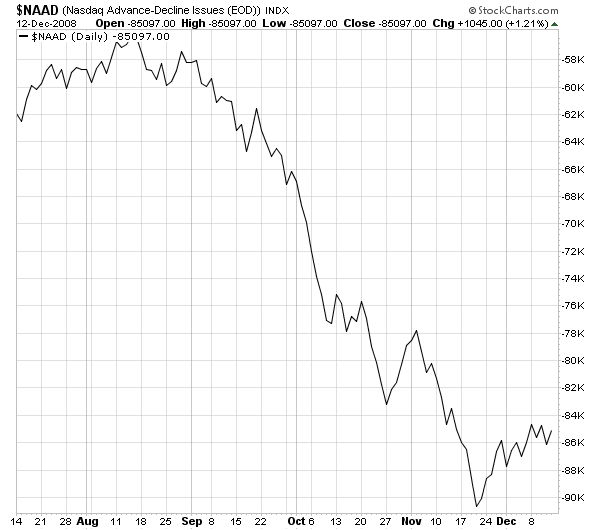
Photobucket

The NASDAQ advance/decline line is also rising and
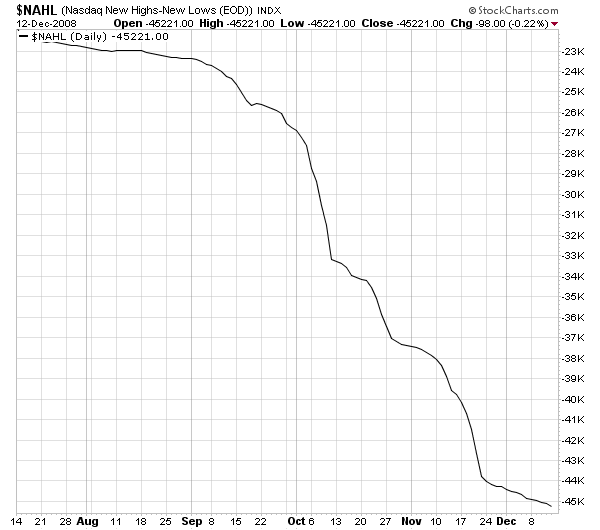
Photobucket

The NASDAQ new high/new low line is declining at a slower rate

So -- what does all of this tell us?

The markets have reacted surprisingly well to incredibly bearish economic news. This tells us traders are priced in a fairly downbeat scenario. At the same time, the market internals are improving. This tells us the market wants to pull out of its downward slump.

My personal big concern is the downward sloping trend channel. Until prices move out of that I'm concerned.

Friday, December 12, 2008

Weekend Weimer and Beagle

Hey folks -- sorry about the lack of posting today. It has really been, well, crazy -- but is a really good way. I'll be back on Monday.

You'd Think I Would Have Posted This Sooner

Below is a video of a panel I participated in last summer. At the time I participated I realized that it was being taped. It just slipped my mind after the panel was over and I forgot about it until I found the recording yesterday. Go figure


Forex Friday's


Click for a larger image

Notice the following on the weekly chart

-- Prices rose 23% over the last 5 months

-- All the SMAs are still moving higher

-- The shorter SMAs are above the longer SMAs

-- Prices have now moved through the 10 week SMA

-- The MACD is overbought

-- The RSI is overbought and declining


Click for a larger image

Notice the following on the dollar's daily chart:

-- Prices are still in an uptrend,

BUT:

-- During the consolidation the RSI and MACD decreased

-- Prices are now below the 10, 20 and 50 day SMA

Bottom line: technically, this chart wants to go lower. Fundamentally the failure of the Detroit bail-out will help to add downward momentum.

Thursday, December 11, 2008

Today's Markets

Photobucket

The overall tone of the market remains negative. The general SMA situation is negative. The 200 and 50 day SMA are moving lower. The 20 is moving sideways. The 10 day SMA is rising, but prices retreated from the 50 day SMA. Should prices move below the 10 day SMA they will bring the 10 day SMA lower.

Although prices were fluctuating just below the 50 day SMA, they did so on decreasing volume indicating decreasing buying interest.

We're Nowhere Near a Bottom in Housing

From Bloomberg:

U.S. foreclosure filings climbed 28 percent in November from a year earlier and a brewing “storm” of new defaults and job losses may force 1 million homeowners from their properties next year, RealtyTrac Inc. said.

A total of 259,085 properties got a default notice, were warned of a pending auction or were foreclosed on last month, the seller of default data said in a report today. That’s the fewest since June. Filings fell 7 percent from October as state laws and lender programs designed to delay the foreclosure process allowed delinquent borrowers to stay in their homes.

“We’re going to see a pretty significant storm next year,” Rick Sharga, executive vice president of marketing for Irvine, California-based RealtyTrac, said in an interview. “There are two or three clouds that suggest a pretty heavy downpour.”

Rising unemployment, expiring foreclosure moratoriums and state efforts that “run out of steam” will push monthly filings toward the record of more than 303,000 set in August, Sharga said. The number of homes that revert to lenders, the last stage of foreclosure and known as “real estate owned” or REO properties, will increase to 1 million from as many as 880,000 this year, he said.


This is what started the whole thing rolling. And it won't end until housing stabilizes. The central problem right now is inventory which is still at high levels in both an absolute and months of inventory on the market sense. Foreclosures are continually adding to that total, which in turn is bringing home prices down. And they won't stop falling until the amount of inventory drops -- which won't happen until foreclosures start to drop.

The Clock Ticks Down for GM

From Bloomberg:

General Motors Corp. has been asked for payments in advance by a small number of auto-parts suppliers after saying it would run out of money by month’s end without U.S. loans, people familiar with the matter said.

GM has rejected the requests, which so far come from a fraction of its 3,600 suppliers, said the people, who asked not to be identified because the discussions are private. GM typically pays vendors about 45 days after getting an invoice.

Demands for upfront cash add to the strain on the biggest U.S. automaker as it waits on a short-term industry rescue in Washington and the shift in power to President-elect Barack Obama and a new Congress in January. Obama favors using federal funds to remake the companies and keep them out of bankruptcy.


This just adds more fuel to the fire.

Thursday Oil Market Round-Up


Click for a larger Image

Notice the following on the weekly chart:

-- Prices are near their lowest level in three years

-- All the SMAs are moving lower

-- The shorter SMAs are below the longer SMAs

-- Prices are below all the SMAs

BUT:

-- The MACD is very oversold and

-- The RSI is very oversold


Click for a larger image

Notice the following on the daily chart:

-- Prices have been dropping for 5 months

-- All the SMAs are moving lower

-- The shorter SMAs are below the longer SMAs

-- Prices are below all the SMAs

BUT:

-- The MACD is rising, and

-- The RSI is oversold

Bottom line: A lot of technical indicators have been calling for a turnaround for the last 3-4 weeks. But it hasn't materialized. Why? Technical indicators are signals that the possibility of something happening is increasing. A technical indicator could be oversold for months without something happening. This is where a knowledge of the fundamental market is vitally important. Oil traders have been talking relentlessly about demand destruction and a global economic slowdown for the last few months. That's the primary driving force in the oil market. I also think there is an issue of the role speculation played in the run-up to 145. And don't forget the rising dollar and its effect of commodity prices.