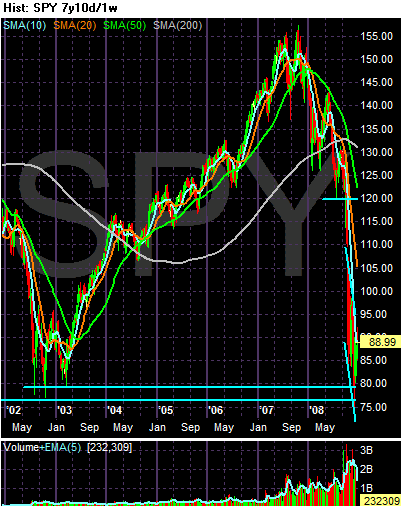
Let's start with a long-view. Above is a 7-year chart of the SPYs in weekly increments. Notice that all gains from the 2003-2007 rally are now gone. The market is trading at levels from the 2002-2003 consolidation.
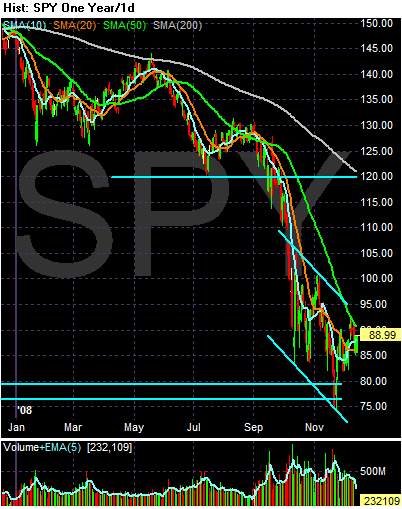
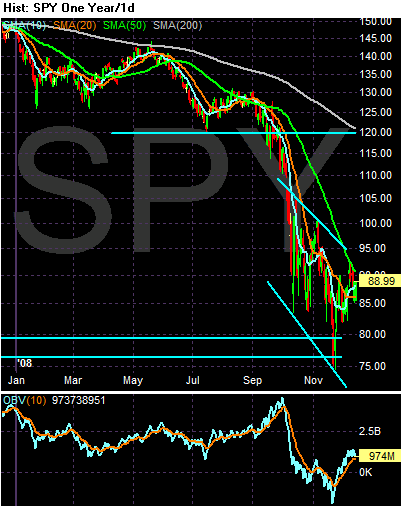
Above is a yearly chart in daily increments. Please note the following:
-- Once prices fell through the 120 level, they dropped hard and fast. They went to 90 (a 25% drop) within a month, and hit the 75 level (a 37.5% drop) wthin two months. Obviously 120 was an incredibly important level for traders
-- There was also a big volume spike on the sell-off indicating a lot of people were simply getting out.
-- The market is 25.84% below the 200 day SMA. In other words, we're clearly in a bear market
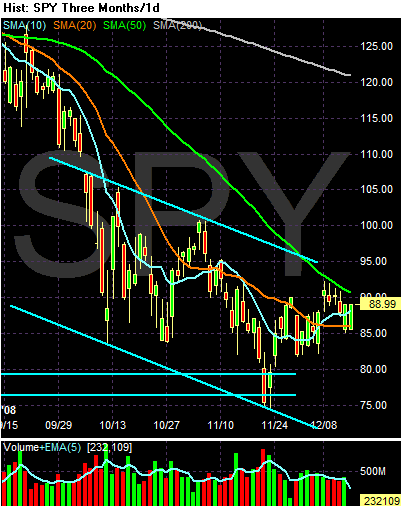
On the 3-month daily chart notice the following:
-- The 50 and 200 day SMA (longer term trends) are both moving lower
-- The 10 day SMA is rising and it has crossed the 20 day SMA
-- The 20 day SMA is neutral (moving sideways)
-- Prices rose to the 50 day SMA but couldn't get over the line. They retreated to the 20 day SMA and bounced higher
-- Prices are still in a downward sloping channel
-- Remember the bearishness of the news over the last few weeks. We've learned the nation as lost over 1 million jobs in the last three months. Retail sales were weak. The auto industry is in deep trouble. If it falls the unemployment situation would worsen fast. And yet, the market has not cratered as bad as possible.
Let's add a few more charts.
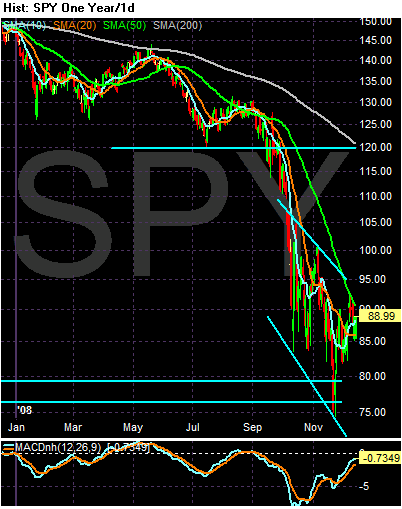
The MACD has been rising for the last two months indicating momentum is changing
As has the On Balance Volume. This tells us that money is flowing into the market
Let's add a few more charts to complete the picture
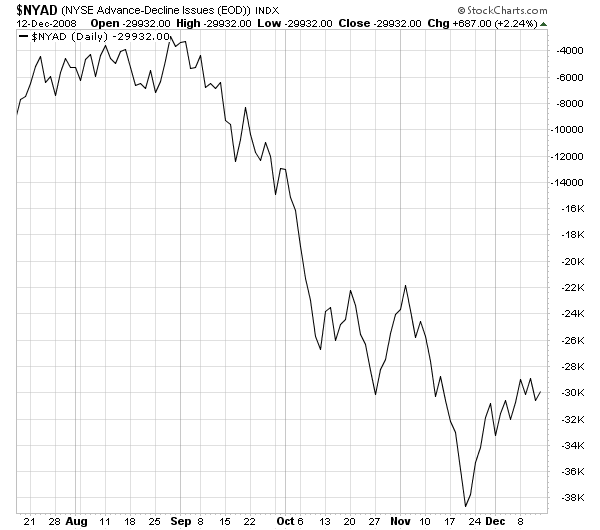
The NY Advance/Decline line is rising
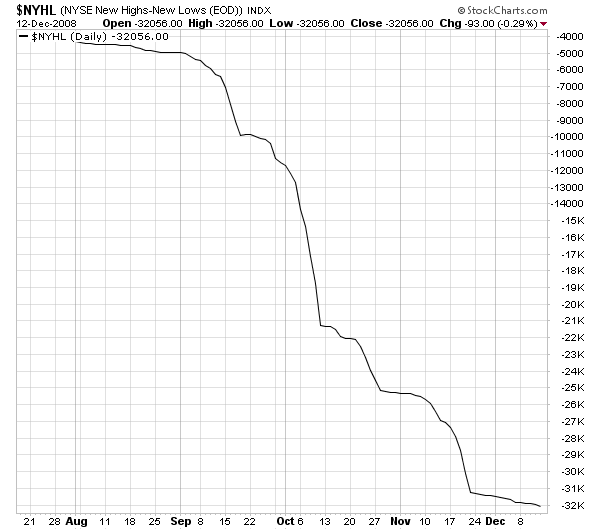
And the downward slope of the NY new high/new low line is lessening
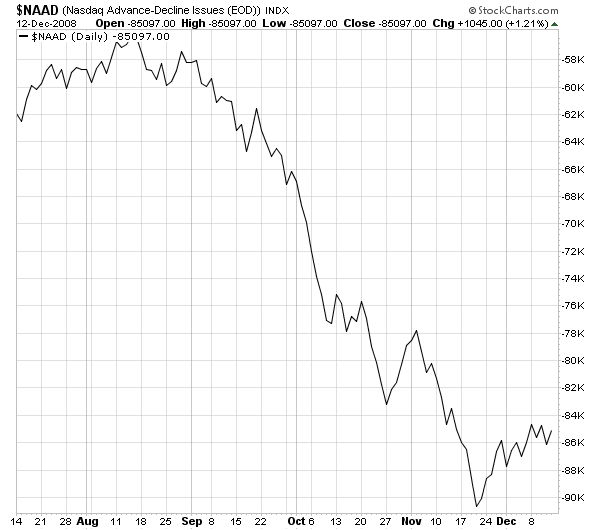
The NASDAQ advance/decline line is also rising and
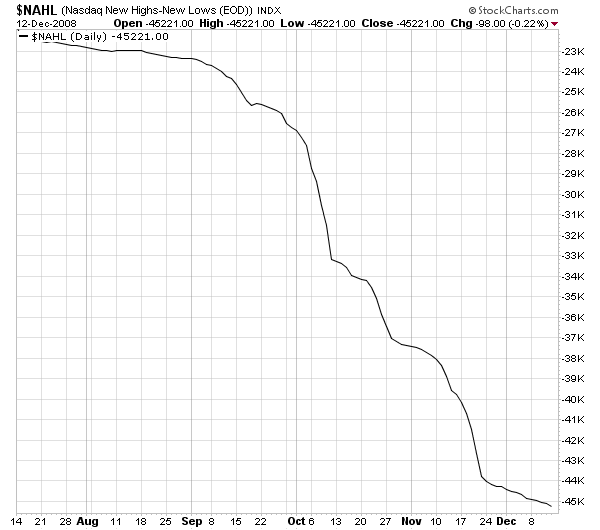
The NASDAQ new high/new low line is declining at a slower rate
So -- what does all of this tell us?
The markets have reacted surprisingly well to incredibly bearish economic news. This tells us traders are priced in a fairly downbeat scenario. At the same time, the market internals are improving. This tells us the market wants to pull out of its downward slump.
My personal big concern is the downward sloping trend channel. Until prices move out of that I'm concerned.