In the wake of popped stock, housing and commodity bubbles, some see a fourth bubble building -- in Treasury bonds. Unlike those bubbles, this one doesn't have to end disastrously.
Treasury yields, which move inversely to prices, are at historic lows. Friday, the yield on the 10-year note fell to 2.47%, the lowest in Federal Reserve records going back to 1962 and well below the average of the past decade of about 4.7%.
Treasurys have been rare good investments in this awful year, returning 10% through November, according to Merrill Lynch chief North American economist David Rosenberg, a longtime bond bull. But even he recently told clients that Treasurys were "clearly heading into a bubble phase" and suggested there might be greener pastures in other fixed-income investments, such as debt backed by government-sponsored entities.
Meanwhile, the U.S. government may post a trillion-dollar budget deficit in the fiscal year ending in September and has pounding fiscal headaches looming far beyond that. Some key buyers of its debt, foreign central banks, are launching their own expensive stimulus packages and would seemingly have better uses for their cash.
And while the U.S. government's access to cheap money helps its efforts to stimulate the economy, it also may crowd out other borrowers. Municipalities and companies with good credit histories are paying exorbitant rates to borrow, arguably extending the pain of the credit crunch.
"We have a remarkable situation in which a 30-year loan to the U.S. government with a taxable instrument pays you 3% and a loan to the state of Ohio pays you 5% tax-free," said David Kotok, president of money-management firm Cumberland Advisors in Vineland, N.J.
A few weeks ago I noted that yields would probably provide some upside resistance for bonds. Remember prices and yields move inversely; as bonds prices rise yields fall. At some point, investors just aren't being compensated for the time risk they are taking (as in lending money for a long period of time).
Unfortunately, this did not take into effect the credit crunch. Right now people are not thinking about return on capital; they are thinking about return of capital. As a result government bonds look pretty good. But take a look at the charts:

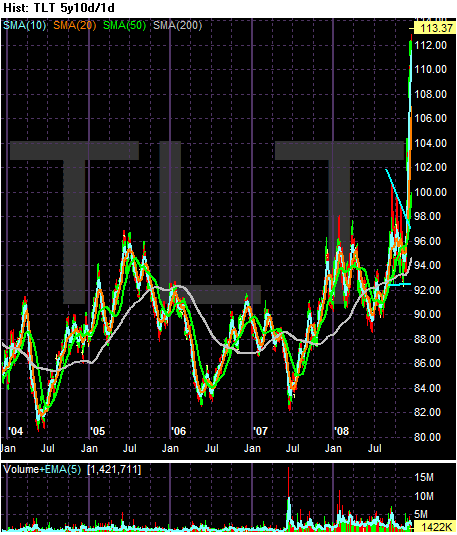
Above is a 5-year chart of the TLTs -- the ETF that tracks the long end of the Treasury curve. Prices remained in an 82 - 96 range for three and a half years from 2005 until the 4Q of 2008. Before that they were trading cheaper. Now take a look -- prices are spiking into record high territory.
Here is a chart of the 30-year yield. Remember the 30 year bond was retired for several years at the beginning of this decade:

Click for a larger image
Yields are now the lowest they have been in over 30 years.

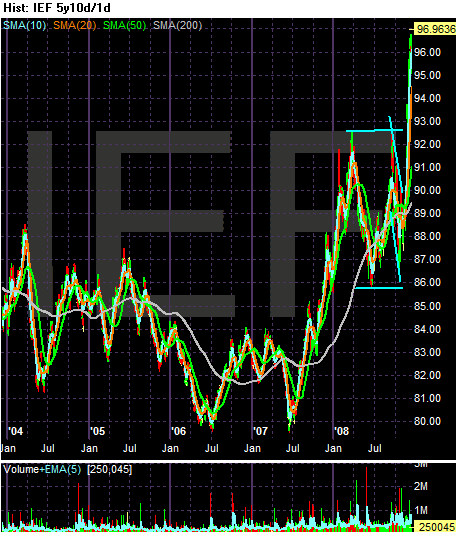
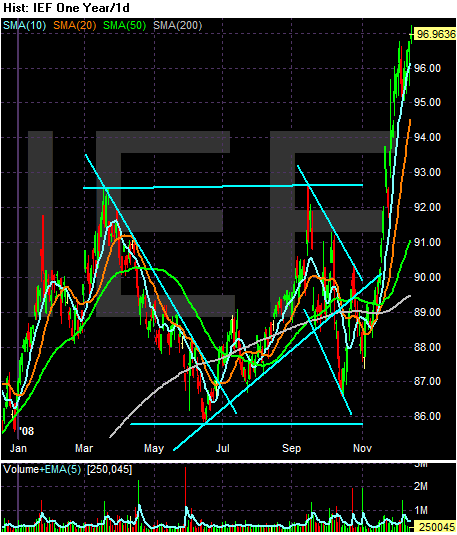
Above is a 5-year chart of the IEFS -- the ETF that tracks the 7-10 year Treasury market. Notice that prices are at record highs. Earlier this year I commented that Treasuries (specifically the IEFs) may be forming a double top, which is better illustrated by the following 1-year chart:

The first top occurred right after the first of March and the second top occurred right at the beginning of September. But notice that prices have moved right through the 92.5 area to make a new top. Here's a chart of the 10-year CMT Treasury's yield -- which moves inversely to price:

Click for a larger image
Again, notice that yields are at multi-decade lows.

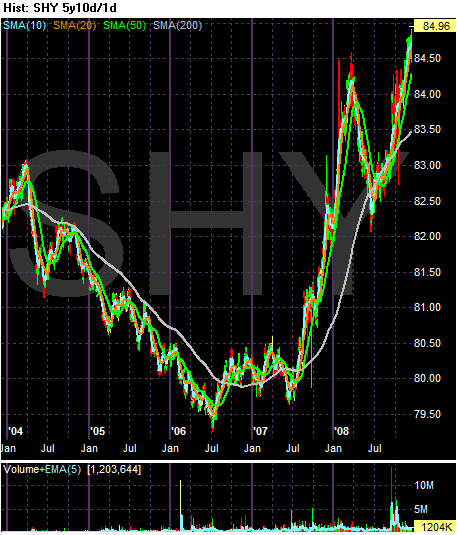
Above is a chart of the SHYs -- the short end of the Treasury curve. Again, notice the price spikes that have occurred in the latest rally.
All of the charts above are "bubble" charts -- prices have spiked to incredibly high levels largely based on panic and concern. Also consider the fiscal backdrop this is occurring in. There are talks of the new administration implementing a $1 trillion spending program over 2 years. That means record deficits. As a result the Treasury will need to borrow big. Increased supply = lower price = higher yield. At least that's what traditional market thinking would lead to.