Friday, August 24, 2012
Morning Market Analysis
The top chart shows the SPYs daily chart, which has broken through support established a little under six months ago. The most logical price target is the 20 day EMA, which is right around the 140 level. On the 60 minute chart, notice that 140 is an important level from the last 30 days.
The treasury market has rebounded, moving beyond its downward sloping channel line. It is currently right in the middle of a Finonacci resistance area. However, so far this is merely a technical reaction to the treasury market's sell-off and the weakness in the equity markets.
Like most markets, the Canadian market is trading in a range right now. The ETC is moving between the 24.5 and 29 price level.
Also note the Canadian dollar is trading in a range as well.
Thursday, August 23, 2012
The Complete Failure of the Economic Pundit Market
From Ezra Klein:
As Joe Weisenthal details, back in September 2009, Ferguson was warning that “long-term rates have risen by 167 basis points in the space of five months,” which “settled a rather public argument” Ferguson had been conducting with Paul Krugman, in which Ferguson argued the markets were turning on our debt and Krugman argued that they were not. So who was right? Well, the interest rate on 10-year Treasuries was 3.73 percent when Ferguson wrote that column. Today, they’re 1.81 percent. Point, Krugman.
Having been rebuffed by the bond market, Ferguson then predicted that we were entering a period that would come to be known as “the great inflation of the 2010s”. We were not. On Sunday, Bloomberg News published an article that began with the sentence, “So much for the inflation warnings.”
These predictions — and others, like when Ferguson warned that ”the Chinese clearly feel they have enough U.S. government bonds” — were the testable hypotheses generated by Ferguson’s worldview. That worldview, in essence, was that the United States was under imminent threat from its debt, and that the result would either be a crisis as the U.S. proved unable to pay its creditors or runaway inflation as the Fed printed money in excess of what the economy could handle.
These predictions were wrong. But Ferguson hasn’t updated the theory to account for their failure. Instead, he has simply applied that same theory to argue that Paul Ryan, who he first met at “a dinner in Washington where the U.S. fiscal crisis was going to be the topic of discussion,” should be vice president, because his deficit-reduction plan could “end four years of economic underperformance [and] stop the terrifying accumulation of debt.”
If Ferguson’s theory had passed its previous tests and we had evidence that the debt is what’s holding back our economy, perhaps that would be a reasonable prediction. But Ferguson’s theory failed its previous tests, and there’s no evidence that debt is what’s holding back our economy right now. Which is one more thing Ferguson never tells you.
And this is really a rather important point about the current crisis. There is a strain of thinking that argued, from the beginning, that Obama’s policies would fail because the required borrowing would send interest rates soaring. Ferguson was a member of this club, but so was the Wall Street Journal editorial board, which warned, back in May 2009, that the bond vigilantes “appear to be returning with a vengeance now that Congress and the Federal Reserve have flooded the world with dollars to beat the recession.”
It is no surprise that most of the folks who bought into this theory were early and enthusiastic backers of Paul Ryan. After all, he bought into this theory, too, and his initial budgets included deep, quick cuts. More so than any other politician, he translated this theory into legislation. But the theory’s primary predictions proved wrong. That has not, however, had any reputational impact on the people who believed those predictions, and their champion is now on the GOP’s presidential ticket, but neither he nor his backers appear to have rethought any element of their critique or of their program.
The above was written in response to the Newsweek cover story story, but it goes to something entirely deeper in the world of economics.
However much the political right may hate Krugman (and there is an almost vitriolic hatred for the man) they can't ignore one basic fact: he's been right for the last three years. Inflation has not reared its ugly head; the bond vigilantes have not come out to play in the markets and we are still mired in a slow-growth environment. Compare that track record to the likes of Art Laffer (perhaps the most appropriately named individual on the plant) and the economists who have been counseling the political right -- and who have also been consistently wrong. And not just slightly wrong, but nearly 100% wrong for the last three years regarding most of the events which have been occurring.
This goes to a deeper division in economics, which you can divide into two camps. Those that agree with Keynes and those that don't. And it is those that agree with Keynes have been right about the current crisis. Case in point are Paul Krugman and Brad DeLong. Also put Marc Thoma in there. Those that are from the University of Chicago School -- John Cochrane and John Taylor are good examples -- have been consistently wrong.
The reason for this is the near pathological avoidance coming from the University of Chicago folks regarding the Great Depression. There is a giant black hole in all of their analysis and it starts in 1929 and ends about 1940. As I wrote a few days ago, the most logical comparison for our current economic situation is that period. This is not rocket science; it's actually pretty simple logic at work. To make the point, read the first 10 pages of Irving Fisher's Debt Deflation Theory of the Great Depression; the parallels to the current situation are near 100% dead-on. And yet no one from the U Chi school of thought is making the comparison. I recently saw a video of John Taylor giving a speech at either the Heritage Foundation or Cato Institute, where he mentioned the current situation. He quickly dismissed the idea that we were in the middle of a debt deflation environment, yet offered no in-depth explanation as to why. And further highlighting this issue -- at least from Taylor's perspective -- is his continual comparison of this expansion to the Reagan recovery which was an entirely different fact pattern. Again, figuring out the appropriate historical comparison isn't that complicated, yet we still see people making it on a regular basis. The 10 year period when Keynes theories were implemented -- and proved successful -- are completely ignored in the hopes that, by ignoring this period -- it will simply retreat from the history books.
But most importantly, despite being universally wrong about the current environment, these people not only have a platform but are actually listened to on a regular basis, And, their opinions -- regardless of the near universal failure of those predictions and prognostications -- are still considered with the same weight as those who have been right. This is what I find utterly baffling. If you have choice between any other professionals and one has a track record of being right and the other has a track record of being wrong, you'd go with the person who was right. That's what the market should do. And yet, it is those people who argue for the absolute unfettered outcome of the market -- who, according to their own analysis should be considered failures -- that still have a platform and are still sought for counsel. That's an amazing failure of the market.
As Joe Weisenthal details, back in September 2009, Ferguson was warning that “long-term rates have risen by 167 basis points in the space of five months,” which “settled a rather public argument” Ferguson had been conducting with Paul Krugman, in which Ferguson argued the markets were turning on our debt and Krugman argued that they were not. So who was right? Well, the interest rate on 10-year Treasuries was 3.73 percent when Ferguson wrote that column. Today, they’re 1.81 percent. Point, Krugman.
Having been rebuffed by the bond market, Ferguson then predicted that we were entering a period that would come to be known as “the great inflation of the 2010s”. We were not. On Sunday, Bloomberg News published an article that began with the sentence, “So much for the inflation warnings.”
These predictions — and others, like when Ferguson warned that ”the Chinese clearly feel they have enough U.S. government bonds” — were the testable hypotheses generated by Ferguson’s worldview. That worldview, in essence, was that the United States was under imminent threat from its debt, and that the result would either be a crisis as the U.S. proved unable to pay its creditors or runaway inflation as the Fed printed money in excess of what the economy could handle.
These predictions were wrong. But Ferguson hasn’t updated the theory to account for their failure. Instead, he has simply applied that same theory to argue that Paul Ryan, who he first met at “a dinner in Washington where the U.S. fiscal crisis was going to be the topic of discussion,” should be vice president, because his deficit-reduction plan could “end four years of economic underperformance [and] stop the terrifying accumulation of debt.”
If Ferguson’s theory had passed its previous tests and we had evidence that the debt is what’s holding back our economy, perhaps that would be a reasonable prediction. But Ferguson’s theory failed its previous tests, and there’s no evidence that debt is what’s holding back our economy right now. Which is one more thing Ferguson never tells you.
And this is really a rather important point about the current crisis. There is a strain of thinking that argued, from the beginning, that Obama’s policies would fail because the required borrowing would send interest rates soaring. Ferguson was a member of this club, but so was the Wall Street Journal editorial board, which warned, back in May 2009, that the bond vigilantes “appear to be returning with a vengeance now that Congress and the Federal Reserve have flooded the world with dollars to beat the recession.”
It is no surprise that most of the folks who bought into this theory were early and enthusiastic backers of Paul Ryan. After all, he bought into this theory, too, and his initial budgets included deep, quick cuts. More so than any other politician, he translated this theory into legislation. But the theory’s primary predictions proved wrong. That has not, however, had any reputational impact on the people who believed those predictions, and their champion is now on the GOP’s presidential ticket, but neither he nor his backers appear to have rethought any element of their critique or of their program.
The above was written in response to the Newsweek cover story story, but it goes to something entirely deeper in the world of economics.
However much the political right may hate Krugman (and there is an almost vitriolic hatred for the man) they can't ignore one basic fact: he's been right for the last three years. Inflation has not reared its ugly head; the bond vigilantes have not come out to play in the markets and we are still mired in a slow-growth environment. Compare that track record to the likes of Art Laffer (perhaps the most appropriately named individual on the plant) and the economists who have been counseling the political right -- and who have also been consistently wrong. And not just slightly wrong, but nearly 100% wrong for the last three years regarding most of the events which have been occurring.
This goes to a deeper division in economics, which you can divide into two camps. Those that agree with Keynes and those that don't. And it is those that agree with Keynes have been right about the current crisis. Case in point are Paul Krugman and Brad DeLong. Also put Marc Thoma in there. Those that are from the University of Chicago School -- John Cochrane and John Taylor are good examples -- have been consistently wrong.
The reason for this is the near pathological avoidance coming from the University of Chicago folks regarding the Great Depression. There is a giant black hole in all of their analysis and it starts in 1929 and ends about 1940. As I wrote a few days ago, the most logical comparison for our current economic situation is that period. This is not rocket science; it's actually pretty simple logic at work. To make the point, read the first 10 pages of Irving Fisher's Debt Deflation Theory of the Great Depression; the parallels to the current situation are near 100% dead-on. And yet no one from the U Chi school of thought is making the comparison. I recently saw a video of John Taylor giving a speech at either the Heritage Foundation or Cato Institute, where he mentioned the current situation. He quickly dismissed the idea that we were in the middle of a debt deflation environment, yet offered no in-depth explanation as to why. And further highlighting this issue -- at least from Taylor's perspective -- is his continual comparison of this expansion to the Reagan recovery which was an entirely different fact pattern. Again, figuring out the appropriate historical comparison isn't that complicated, yet we still see people making it on a regular basis. The 10 year period when Keynes theories were implemented -- and proved successful -- are completely ignored in the hopes that, by ignoring this period -- it will simply retreat from the history books.
But most importantly, despite being universally wrong about the current environment, these people not only have a platform but are actually listened to on a regular basis, And, their opinions -- regardless of the near universal failure of those predictions and prognostications -- are still considered with the same weight as those who have been right. This is what I find utterly baffling. If you have choice between any other professionals and one has a track record of being right and the other has a track record of being wrong, you'd go with the person who was right. That's what the market should do. And yet, it is those people who argue for the absolute unfettered outcome of the market -- who, according to their own analysis should be considered failures -- that still have a platform and are still sought for counsel. That's an amazing failure of the market.
Morning Market Analysis
The entire grains complex is still at elevated levels. Corn (top chart) broke through resistance, but printed a hanging man bar yesterday (which many traders take as a reversal pattern). Soybeans (middle chart) has a similar chart to corn, although there were a few days of pretty solid gains. Wheat (bottom chart) is still in a downward sloping pennant pattern.
The reason for these high prices is the worst drought conditions since the late 1980s.
The longer term chart of the British market still shows a sideways consolidation pattern in play. Prices are still a bit above the 200 week EMA with a rising MACD. But the CMF shows declining market participation. Also note the declining volume as prices have rallied over the last few weeks.
Last week I noted that the Spanish market may be making a bottom, based on the possibility of a classic double-bottom pattern. Now the market has rallied from its bottom. , moving through resistance around the 25 price level. However, this is more of a technical bounce than anything else.
In the same post, I noted the Italian market was in a similar situation, although I wasn't as confident with the overall pattern. Well, it, too, has rebounded in a similar manner.
Wednesday, August 22, 2012
Bonddad Linkfest
- Can more Chinese Stimulus help? (Marketwatch)
- China's steel production paradox (Marketwatch)
- Ag markets "panic" (Agrimoney)
- Winter wheat prospects declining (Agrimoney)
- West Australia wheat crop in jeopardy (Agrimoney)
- Japan's exports to the EU drop a quarter (FT)
- Chinese steel prices drop to 2009 levels (FT)
- Midwest crop tour issues weak estimates (FT)
In which I trash a garbage indicator (literally)
- by New Deal democrat
In the last few days, the following graph has gotten a lot of attention, in particular from Ezra Klein, who discussed it last night on MSNBC:
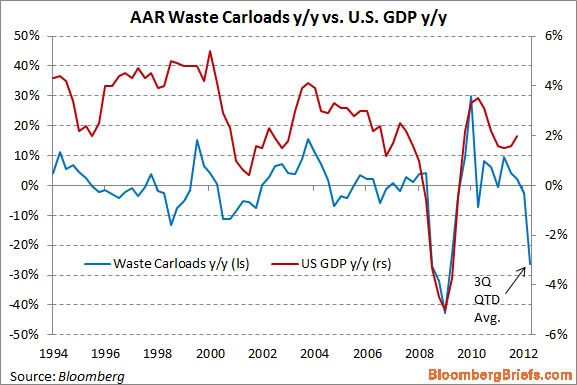
This graph purports to show that, based on railroad hauling of trash, the economy is tanking this quarter.
Being a nerd, when I saw the graph I did some research. It turns out that the graph is very misleading. In the first place, it is computed on a quarterly basis - except for this quarter, in which it is YoY only for the first 6 weeks of this quarter vs. the first six weeks of the third quarter of 2011 (note the latest value in the graph is labeled "QTD" or "quarter to date.").
Further, since it is YoY, you have to check to see if the real anomaly is in the last year vs. this year. And when you do that, you find out that there was a huge bump in railcar hauling in July and August of last year of scrap metal (I haven't found any particular reason why at this point). This year is about 1.5% ahead of 2010 for the comparable 6 weeks, but in 2011 scrap metal hauling was about 32% ahead of 2010 for the same 6 week period. In the final 7 weeks of the quarter, (particularly in September) of last year, scrap metal hauling was much more subdued compared with 2010.
More specifically, the information on the graph above comes from lines 18 and 19 of the weekly AAR report, the same report I describe every Saturday in my "Weekly Indicators" column. Here's the total of rail carloads for the first 6 weeks of the third quarter in 2010, 2011, and this year for line 18, scrap metals:
- 2010: 21,071
- 2011: 27,769
- 2012: 21,392
Now here's the same totals for line 19, municipal waste:
- 2010: 23,279
- 2011: 19,546
- 2012: 18,223
Thus, there was actually a much more severe contraction for the same 6 week period last year, -12.1%, in municipal waste hauling than this year, due to increasing recycling efforts, apparently without causing an economic crash. Put another way, last year a large contraction in municipal waste hauling acted largely to counterbalance the anomalous surge in scrap metal hauling. This year a much smaller decline in municipal waste hauling is amplifying the return to prior trend in scrap metal hauling.
By contrast, here are the number of rail carloads for the remaining 7 weeks of the third quarter in 2010 and 2011 for scrap metals:
- 2010: 30,034
- 2011: 33,205
And here are the totals for the remaining 7 weeks for municipal waste:
- 2010: 27,612
- 2011: 24,320
In the last seven weeks of the third quarter last year, scrap metal hauling was only up +10.6%, and municipal waste was down -12.0%. So for the full quarter last year, the YoY increase of scrap metal and municipal waste combined was only +2.8%.
But the comparison of the first 6 weeks vs. the final 7 weeks of the third quarter last year -- which was huge -- isn't reflected in the graph.
Had the graph compared apples to apples, there would have been a huge increase last year balanced by an equal decrease this year. If you're not going to do that, then you have to wait to see how the entire third quarter plays out - which would deprive you of the trashy sexy graph of DOOM!
So here's the moral of the story of the alleged trash indicator: garbage in, garbage out.
France: Weakening Growth With Some Underlying Problems
Let's now turn to France, to get an overview of their economy.
Overall, we see the same type of growth pattern as Germany; coming out of the recession France printed some OK numbers, but the economy has been slowing and is now just barely positive.
Industrial production's overall Y/O/Y growth has been negative for the entire year -- obviously not a good development.
Oddly enough, Y/O/Y percentage change in retail sales have been fairly decent.
There are two big deficit issues with the French economy: a budget deficit and current account deficit. As a result, France must continually be attractive to foreign investors in order to continue operating in this manner.
Despite the above mentioned deficits, notice that government bond yields are actually very low -- currently coming in at just over 2%.
The unemployment rate is big issue for obvious reasons.
However, inflation appears to be under control.
Overall, we see the same type of growth pattern as Germany; coming out of the recession France printed some OK numbers, but the economy has been slowing and is now just barely positive.
Industrial production's overall Y/O/Y growth has been negative for the entire year -- obviously not a good development.
Oddly enough, Y/O/Y percentage change in retail sales have been fairly decent.
There are two big deficit issues with the French economy: a budget deficit and current account deficit. As a result, France must continually be attractive to foreign investors in order to continue operating in this manner.
Despite the above mentioned deficits, notice that government bond yields are actually very low -- currently coming in at just over 2%.
The unemployment rate is big issue for obvious reasons.
However, inflation appears to be under control.
Why John Carney Needs to Buy a Dictionary
John Carney wrote (I am almost embarrassed to link to this 3rd grade level of logic) a defense piece of self-proclaimed (and widely discredited) economic expert Niall Ferguson over at CNBC that demonstrated little other than the fact that Carney is an anti-tax shill and is willing to redefine words to his own liking in order to make a case. In case you were wondering John, the word "deficit" actually has a meaning:
"a : an excess of expenditure over revenue"(from Merriam-Webster)
Notice that the definition of the word itself references revenue. In other words, things that are paid for with revenue do not create deficits. By definition they cannot, as a deficit is the difference between revenue and expenditure, not expenditure by itself. While I know that CNBC (like many other news organizations sadly) cares little about the accuracy of its reports or their neutrality, someone needs to call people that do not have a basic understanding of the English language and facts to the carpet for misrepresentation and outright fabrication.
Not only was Niall Ferguson 100% wrong, but now John Carney and CNBC have doubled down with an intentional redefinition of the word deficit in a weak defense of Ferguson. How about some integrity CNBC?
========
NDD here with the incredibly stupid claim Carney is making, verbatim:
Oh.
The Stupid. It burns!
"a : an excess of expenditure over revenue"(from Merriam-Webster)
Notice that the definition of the word itself references revenue. In other words, things that are paid for with revenue do not create deficits. By definition they cannot, as a deficit is the difference between revenue and expenditure, not expenditure by itself. While I know that CNBC (like many other news organizations sadly) cares little about the accuracy of its reports or their neutrality, someone needs to call people that do not have a basic understanding of the English language and facts to the carpet for misrepresentation and outright fabrication.
Not only was Niall Ferguson 100% wrong, but now John Carney and CNBC have doubled down with an intentional redefinition of the word deficit in a weak defense of Ferguson. How about some integrity CNBC?
========
NDD here with the incredibly stupid claim Carney is making, verbatim:
I think it is fair enough to argue that increased expenditures paid for by new taxes and fees are the equivalent of deficit increases. ...See, when you pay cash for something at the store, all you're really doing is fast-forwarding your credit card bill.
The primary critique of budget deficits is that they create debt obligations that will have to be paid for by tax increases on future generations. But the ACA creates new government obligations and pays for them (in part) with tax increases immediately. That is just debt in fast-forward. It inflicts immediately the very harm—higher taxes—that deficit-spending supposedly inflicts in the future.
Oh.
The Stupid. It burns!
Morning Market Analysis
All of the above charts are of the SPYs. The top chart shows the daily price action. Prices have moved about resistance and are now near 6 months highs. All the EMAs are moving higher; momentum and prices are strong. The lower two charts put the latest rally in perspective. The middle chart shows 60 minutes time increments. The market has enjoyed a nice, consistent uptrend. However, the lower chart -- which is in 30 minute increments -- shows prices have broken trend.
Above is a 5 minute SPY chart. After 10 AM, prices started moving lower, and continued moving lower for the entire trading session. This is what led to the trend break on the 30 minute chart.
Given the length of the latest rally and yesterday's price action, I think we'll see some profit taking over the short term.
The homebuilding sector rallied from October to April of this year. Then the sector sold-off to highs established last spring. However, prices have now moved through highs again. Also note the bullish EMA picture, rising CMF and buy signal from the MACD.
The daily chart of the XHBs shows prices consolidating for most of the last six months, trading between the 19.5 and 22 price levels. However, prices have clearly broken out. Notice the bullish EMA pattern and rising MACD.
Tuesday, August 21, 2012
Germany: The EU Powerhouse
Germany stands out as an economy that has basically done everything right. Let's look at the data.
First, note that coming our of the recession, Germany was printing some impressive annual GDP growth numbers. But, while Germany's overall growth rate is still positive, notice that it has been slowing over the last four quarters.
Oddly enough, the lowest German unemployment reached was about 6.4%. In the US, 5% is considered full employment; this number will change depending on the economy, but 6.4% seems high for a maximum employment reading. This number has ticked up recently, largely because of the GDP drop. But, that is to be expected.
In general, the pace of retail sales is positive, and is largely due to the strong growth and low unemployment.
And German industrial production has rebounded from the downturn that occurred earlier in the year.
To me, this is the strongest chart from Germany: their overall current account as a percent of GDP has been strongly positive for nearly 10 years. Put another way, Germany is an export powerhouse.
And while the government is running a budget deficit, it's clearly under control
And, inflation appears to be under control, although the ECB is as much responsible for this as the Bundesbank.
In short, even with the GDP slowdown, German looks to be in decent shape.
First, note that coming our of the recession, Germany was printing some impressive annual GDP growth numbers. But, while Germany's overall growth rate is still positive, notice that it has been slowing over the last four quarters.
Oddly enough, the lowest German unemployment reached was about 6.4%. In the US, 5% is considered full employment; this number will change depending on the economy, but 6.4% seems high for a maximum employment reading. This number has ticked up recently, largely because of the GDP drop. But, that is to be expected.
In general, the pace of retail sales is positive, and is largely due to the strong growth and low unemployment.
And German industrial production has rebounded from the downturn that occurred earlier in the year.
To me, this is the strongest chart from Germany: their overall current account as a percent of GDP has been strongly positive for nearly 10 years. Put another way, Germany is an export powerhouse.
And while the government is running a budget deficit, it's clearly under control
And, inflation appears to be under control, although the ECB is as much responsible for this as the Bundesbank.
In short, even with the GDP slowdown, German looks to be in decent shape.
The Stupid. It Burns.
Quick -- what was the last big financial crisis in the US? If you said The Great Depression, you get prize (in inflation adjusted dollars). So, given that we've just experienced a big financial crash (the popping of a very large credit and asset bubble), what would be the first place in economic history you'd look to make comparisons to the present recovery? The Great Depression -- again, you get a prize.
So -- what is it with conservative economists and their deliberate attempt to completely overlook the Great Depression comparison to our current recovery? It's like there's a blind spot in their analytical abilities which prevents them from even mentioning this period in history.
Let's start with John Taylor -- WSJ editorial page darling and one of four authors of the Mitt Romney economic manifesto. Once again, Taylor compares the current recovery to the 1980s recovery. Of course, the two are entirely different fact patterns, with the 1980s recession caused by the Fed spiking interest rates to kill inflation, while here we're dealing with a massive de-leveraging of the household sector. As I've pointed out before (see here and here) Taylor has a habit of doing anything to demonstrate his unadulterated fealty to the Reagan myth (BTW: Reagan's dead, you're old; get over it.). Your absolute devotion is noted, although it's not helping your reputation.
And now -- not to be outdone in demonstrating the absolute highest level of stupidity -- is John Cochrane, who argues that slow recoveries after a financial crisis aren't the norm because the Administration's Budget Proposals proposed a faster than normal recovery from the 2008 financial crisis. First, raise your hand if you think this is an economic document or a political document (hint: the source of the writing may be a more than insignificant clue). Secondly, when was the last time you say a government agency involved in the economy say, "things are really going to suck for awhile." In fact, what they really say is things like, "below trend growth," or "we expect sub-par demand." Why? Because they have to instill confidence in the markets that they have a handle on what's happening. And then there's the fact the the original estimates for the depth of the recession were way too shallow:
The Bureau of Economic Analysis, the agency charged with measuring the size and growth of the U.S. economy, initially projected that the economy shrank at an annual rate of 3.8 percent in the last quarter of 2008. Months later, the bureau almost doubled that estimate, saying the number was 6.2 percent. Then it was revised to 6.3 percent. But it wasn’t until this year that the actual number was revealed: 8.9 percent. That makes it one of the worst quarters in American history. Bernstein and Romer knew in 2008 that the economy had sustained a tough blow; t hey didn’t know that it had been run over by a truck.
And finally, compare the budget projections in the 2003 Economic Report to the President (see table 1.1) with the actual performance. The Report's projections are off between .5% and 1% for the recovery -- and you really don't want to go into a comparison of the mammoth numbers of jobs promised versus what was really delivered, do you? In short, this isn't the first administration to over-promise and under-deliver.
Memo to Taylor and Cochrane: you're smarter than this. No, really, you are. Please rise to the level of analysis I've come to expect from people who have supposedly studied a particular discipline in depth.
So -- what is it with conservative economists and their deliberate attempt to completely overlook the Great Depression comparison to our current recovery? It's like there's a blind spot in their analytical abilities which prevents them from even mentioning this period in history.
Let's start with John Taylor -- WSJ editorial page darling and one of four authors of the Mitt Romney economic manifesto. Once again, Taylor compares the current recovery to the 1980s recovery. Of course, the two are entirely different fact patterns, with the 1980s recession caused by the Fed spiking interest rates to kill inflation, while here we're dealing with a massive de-leveraging of the household sector. As I've pointed out before (see here and here) Taylor has a habit of doing anything to demonstrate his unadulterated fealty to the Reagan myth (BTW: Reagan's dead, you're old; get over it.). Your absolute devotion is noted, although it's not helping your reputation.
And now -- not to be outdone in demonstrating the absolute highest level of stupidity -- is John Cochrane, who argues that slow recoveries after a financial crisis aren't the norm because the Administration's Budget Proposals proposed a faster than normal recovery from the 2008 financial crisis. First, raise your hand if you think this is an economic document or a political document (hint: the source of the writing may be a more than insignificant clue). Secondly, when was the last time you say a government agency involved in the economy say, "things are really going to suck for awhile." In fact, what they really say is things like, "below trend growth," or "we expect sub-par demand." Why? Because they have to instill confidence in the markets that they have a handle on what's happening. And then there's the fact the the original estimates for the depth of the recession were way too shallow:
The Bureau of Economic Analysis, the agency charged with measuring the size and growth of the U.S. economy, initially projected that the economy shrank at an annual rate of 3.8 percent in the last quarter of 2008. Months later, the bureau almost doubled that estimate, saying the number was 6.2 percent. Then it was revised to 6.3 percent. But it wasn’t until this year that the actual number was revealed: 8.9 percent. That makes it one of the worst quarters in American history. Bernstein and Romer knew in 2008 that the economy had sustained a tough blow; t hey didn’t know that it had been run over by a truck.
And finally, compare the budget projections in the 2003 Economic Report to the President (see table 1.1) with the actual performance. The Report's projections are off between .5% and 1% for the recovery -- and you really don't want to go into a comparison of the mammoth numbers of jobs promised versus what was really delivered, do you? In short, this isn't the first administration to over-promise and under-deliver.
Memo to Taylor and Cochrane: you're smarter than this. No, really, you are. Please rise to the level of analysis I've come to expect from people who have supposedly studied a particular discipline in depth.
Morning Market Analysis
Above we see weekly charts for the treasury curve. The IEIs (top chart) have broken a trend and the IEFs and TLTs (middle and bottom) charts are right at longer-term support. Also note that all three charts have a weakening momentum and relative price indicators. Money is clearly leaving the market, indicating that the overall risk on trade is back.
The long-term dollar chart shows a slight upward bearing, but certainly not a strong rally. It's really more of a meandering/moving grudgingly higher rally.
Copper is consolidating between the 42 and 44 price levels. Also notice the importance of the 42 price level from prices established in late 2012.
Monday, August 20, 2012
The one crucial graph that shows why we haven't gone back into recession
- by New Deal democrat
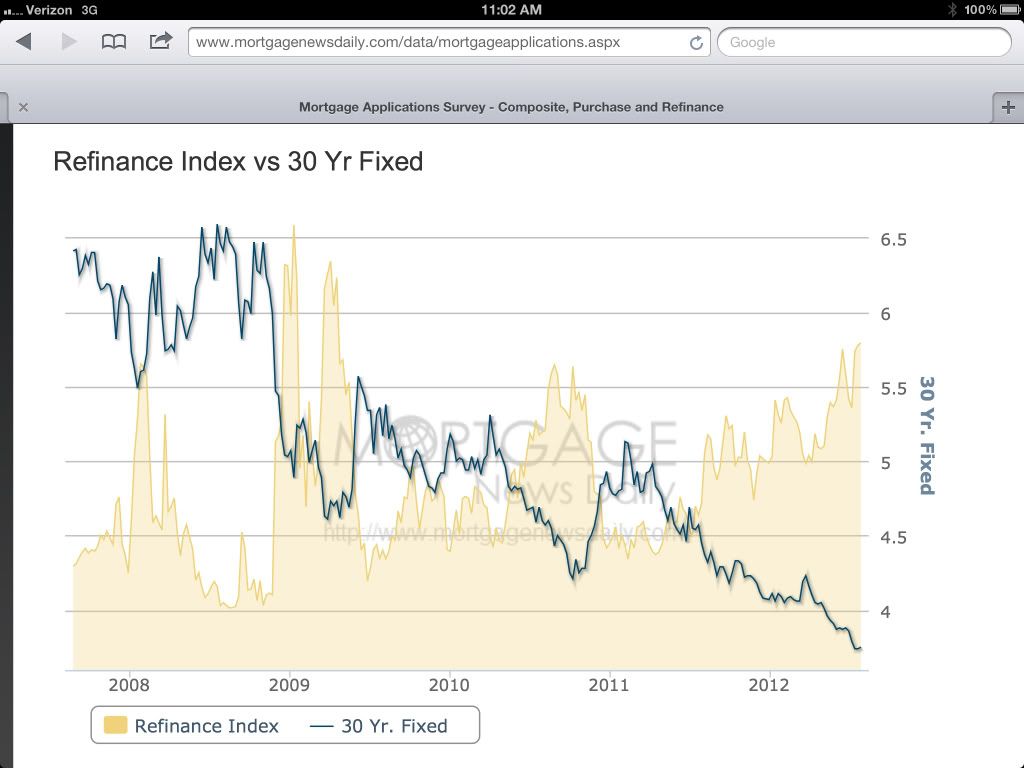
Mortgage refinancing:
(via Mortgage News Daily)(blue line represents mortgage rate; yellow area represents amount of mortgage refinancing. Note the nearly continuous surge in refinancing during the last year).
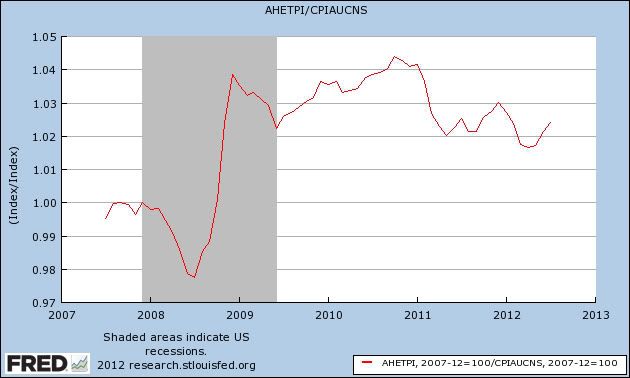
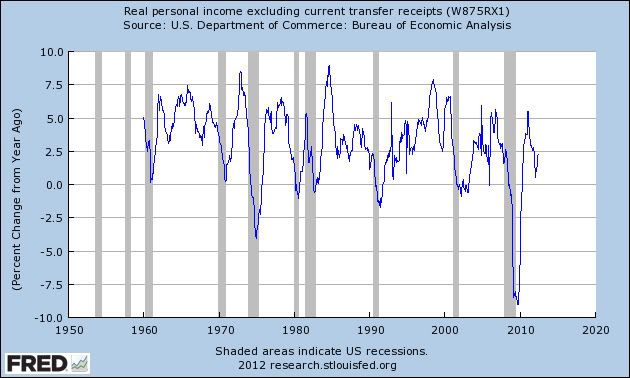
As I pointed out as recently as Friday, real income growth during the last three years since the recession bottomed has been lackluster to say the least. One of the mainstays of ECRI's likely incorrect recession call is that real income has never fallen below +1.5% without a recession ensuing. Truth be told, during the recovery real income has barely ever gotten above that level, an abysmal showing compared with all past WW2 recoveries:
In fact, in real terms, average wages have fallen in the last couple of years:
"width=500>
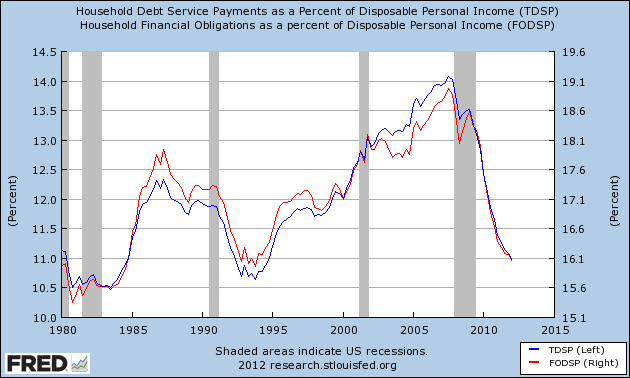
But because of refinancing of debt, the total household debt purden as a percentage of income has continued to fall:
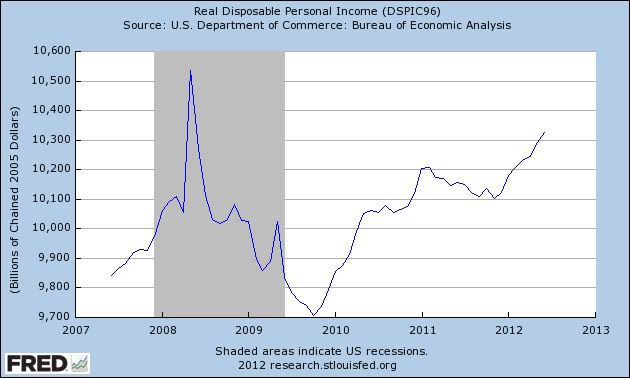
And real disposable personal income has risen at the annualized rate of 4%+ since bottoming last November:
While rising real pesonal disposable income hasn't always negatived a rescession (see 1970 as well as 2008), typically it falls during a recession, and as the below graph shows, when it has fallen during recessions, once the rate has risen back above +2.5% on a YoY basis, the recession has always been over:
If the trend since the end of last year continues (as to which there is no guarantee), then we are at 2.5%+ YoY in real disposable personal income right now, although we won't know it until the data is reported 2 months from now.
To the extent the Fed's quantitative easing programs have enable the refinancing that has stopped the economy from entering a renewed recession, they have been a resounding success.
An Overview of the EU Economic Situation
Lost in the headlines coming out of Europe is any real mention of their overall economic well-being. So, let's remedy that problem by doing just that -- looking at the data.
The overall annual EU growth rate has been declining for the last 5 quarters. This is obviously caused by the Greek/debt crisis (which is negatively impacting confidence) but is also the end result of austerity policies which also lower growth.
The above data is from the latest Eurostat GDP report. The left side contains quarter to quarter data, while the right side contains year over year data. I've circled the last quarters where there has been a decrease and placed rectangles around time series that show more than one quarter of contraction. Notice that Italy, Cyprus, Hungary, Greece, Spain, Portugal and the Czech Republic are experiencing lengthy economic downturns. Also note the UK falls into this category. Belgium and Finland are now adding to the countries that are experiencing trouble. In short, there are problems across the eurozone that are widespread.
As a result of the weak economic growth, we see a continued increase in unemployment, which hit 11.2% recently and has held there.
Slower economic growth also leads to lower industrial production. This number has been negative for the better part of the year.
The above chart from the latest Markit manufacturing report shows the breadth of the manufacturing slowdown. It's basically hitting the entire euro area.
The above chart shows the Y/O/Y percentage change in retail sales. This is another poor chart, but it is to be expected considering the overall economic backdrop.
There are a few good data points.
Inflation is low -- and it's been declining.
While there is a current account deficit, it's actually pretty low.
But, in short, the EU economy is grinding slower.
The overall annual EU growth rate has been declining for the last 5 quarters. This is obviously caused by the Greek/debt crisis (which is negatively impacting confidence) but is also the end result of austerity policies which also lower growth.
The above data is from the latest Eurostat GDP report. The left side contains quarter to quarter data, while the right side contains year over year data. I've circled the last quarters where there has been a decrease and placed rectangles around time series that show more than one quarter of contraction. Notice that Italy, Cyprus, Hungary, Greece, Spain, Portugal and the Czech Republic are experiencing lengthy economic downturns. Also note the UK falls into this category. Belgium and Finland are now adding to the countries that are experiencing trouble. In short, there are problems across the eurozone that are widespread.
As a result of the weak economic growth, we see a continued increase in unemployment, which hit 11.2% recently and has held there.
Slower economic growth also leads to lower industrial production. This number has been negative for the better part of the year.
The above chart from the latest Markit manufacturing report shows the breadth of the manufacturing slowdown. It's basically hitting the entire euro area.
The above chart shows the Y/O/Y percentage change in retail sales. This is another poor chart, but it is to be expected considering the overall economic backdrop.
There are a few good data points.
Inflation is low -- and it's been declining.
While there is a current account deficit, it's actually pretty low.
But, in short, the EU economy is grinding slower.
Subscribe to:
Posts (Atom)