- by New Deal democrat
Mortgage refinancing:
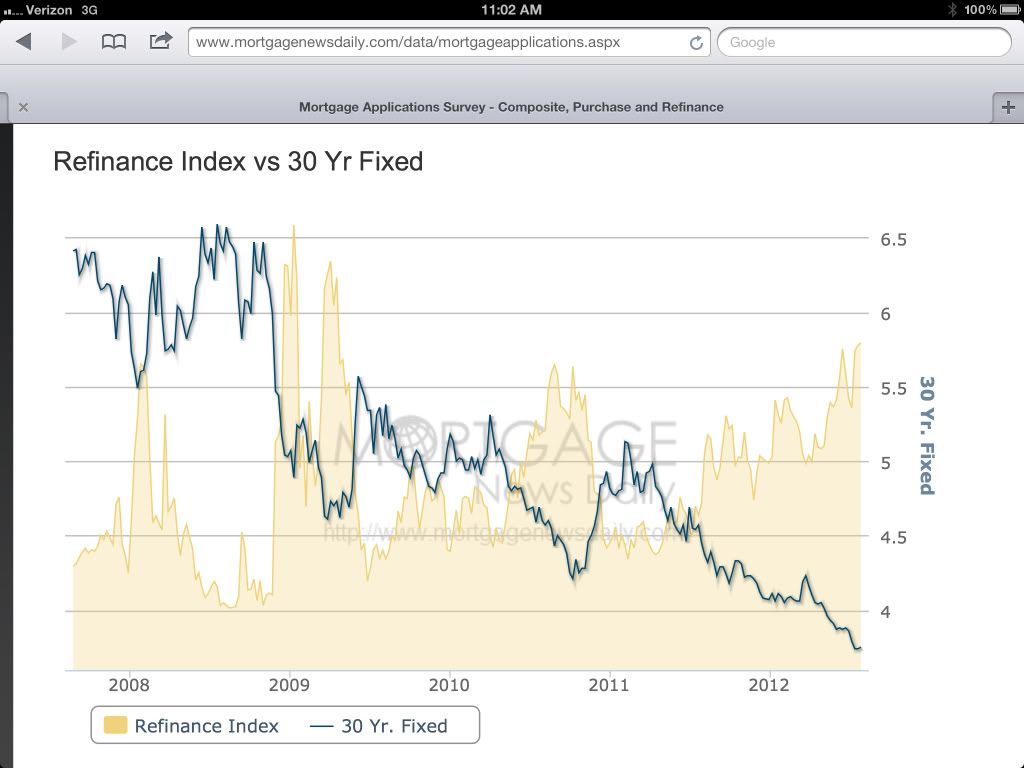
(via Mortgage News Daily)(blue line represents mortgage rate; yellow area represents amount of mortgage refinancing. Note the nearly continuous surge in refinancing during the last year).
As I pointed out as recently as Friday, real income growth during the last three years since the recession bottomed has been lackluster to say the least. One of the mainstays of ECRI's likely incorrect recession call is that real income has never fallen below +1.5% without a recession ensuing. Truth be told, during the recovery real income has barely ever gotten above that level, an abysmal showing compared with all past WW2 recoveries:

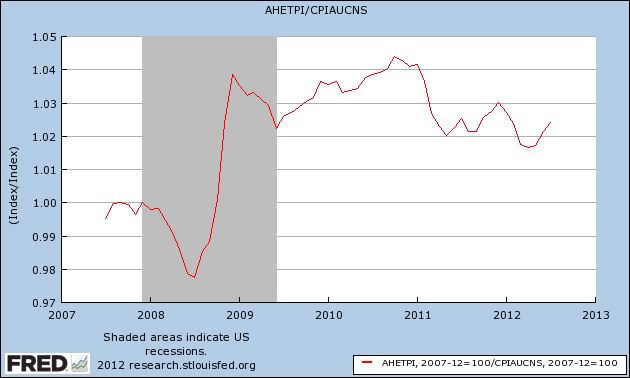
In fact, in real terms, average wages have fallen in the last couple of years:
 "width=500>
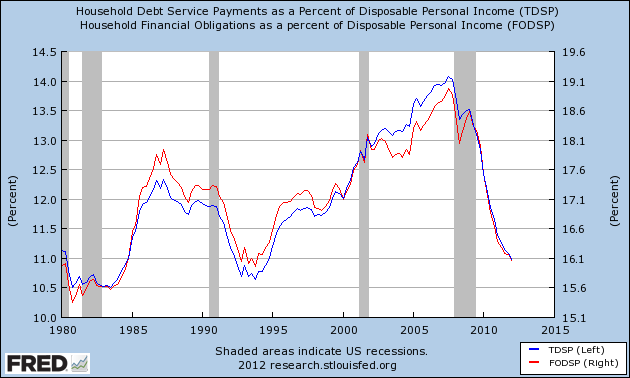
But because of refinancing of debt, the total household debt purden as a percentage of income has continued to fall:
And real disposable personal income has risen at the annualized rate of 4%+ since bottoming last November:
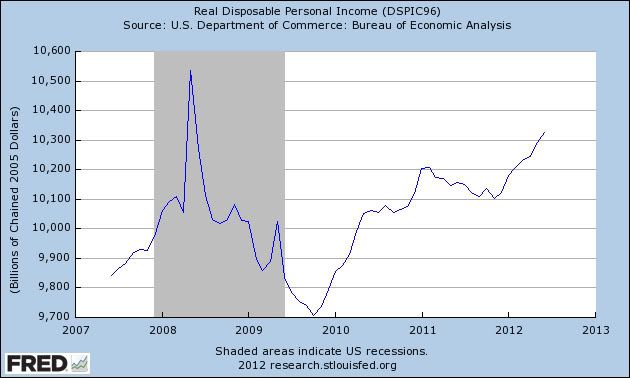
While rising real pesonal disposable income hasn't always negatived a rescession (see 1970 as well as 2008), typically it falls during a recession, and as the below graph shows, when it has fallen during recessions, once the rate has risen back above +2.5% on a YoY basis, the recession has always been over:
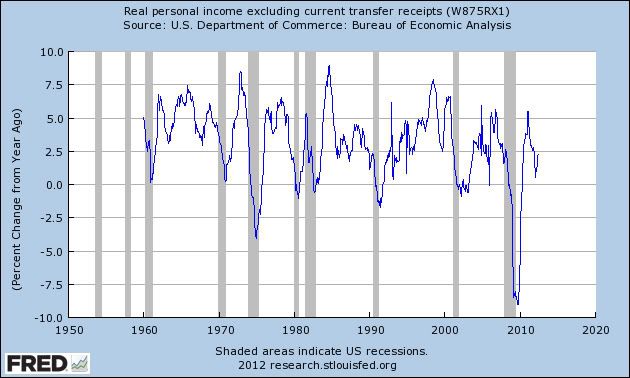
If the trend since the end of last year continues (as to which there is no guarantee), then we are at 2.5%+ YoY in real disposable personal income right now, although we won't know it until the data is reported 2 months from now.
To the extent the Fed's quantitative easing programs have enable the refinancing that has stopped the economy from entering a renewed recession, they have been a resounding success.