Showing posts with label debunking crap. Show all posts
Showing posts with label debunking crap. Show all posts
Sunday, December 9, 2012
3 questions for Mish
- by New Deal democrat
Today Mish cites to Gallup's report that spending by upper income households declined sharply in November although overall November consumer spending was higher than 2011, which in turn as higher than 2010 and 2009.
While the 14 day overage for all consumers in November 2011 spending was faily stable, at $71 for the first part and $73 per Gallup, this year was much more erratic, at $65 in the first part and $81 by the end.
So, here are three questions for Mish:
- 1. What is the average income in the New York City area compared with the national average?
- 2. What is the average income in New Jersey compared with the national average?
- 3. Can you think of anything that might have happened to impact consumer spending in the NYC and NJ areas in November of this year, especially during the first part?


Wednesday, August 22, 2012
In which I trash a garbage indicator (literally)
- by New Deal democrat
In the last few days, the following graph has gotten a lot of attention, in particular from Ezra Klein, who discussed it last night on MSNBC:
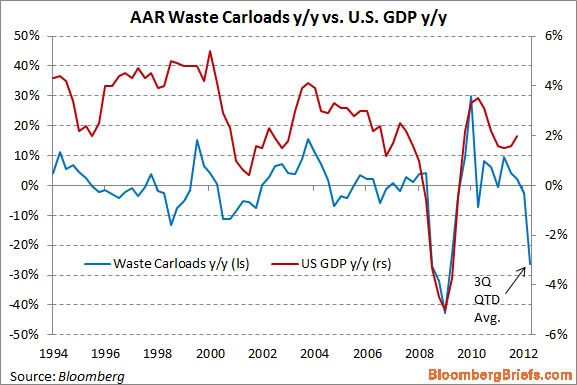
This graph purports to show that, based on railroad hauling of trash, the economy is tanking this quarter.
Being a nerd, when I saw the graph I did some research. It turns out that the graph is very misleading. In the first place, it is computed on a quarterly basis - except for this quarter, in which it is YoY only for the first 6 weeks of this quarter vs. the first six weeks of the third quarter of 2011 (note the latest value in the graph is labeled "QTD" or "quarter to date.").
Further, since it is YoY, you have to check to see if the real anomaly is in the last year vs. this year. And when you do that, you find out that there was a huge bump in railcar hauling in July and August of last year of scrap metal (I haven't found any particular reason why at this point). This year is about 1.5% ahead of 2010 for the comparable 6 weeks, but in 2011 scrap metal hauling was about 32% ahead of 2010 for the same 6 week period. In the final 7 weeks of the quarter, (particularly in September) of last year, scrap metal hauling was much more subdued compared with 2010.
More specifically, the information on the graph above comes from lines 18 and 19 of the weekly AAR report, the same report I describe every Saturday in my "Weekly Indicators" column. Here's the total of rail carloads for the first 6 weeks of the third quarter in 2010, 2011, and this year for line 18, scrap metals:
- 2010: 21,071
- 2011: 27,769
- 2012: 21,392
Now here's the same totals for line 19, municipal waste:
- 2010: 23,279
- 2011: 19,546
- 2012: 18,223
Thus, there was actually a much more severe contraction for the same 6 week period last year, -12.1%, in municipal waste hauling than this year, due to increasing recycling efforts, apparently without causing an economic crash. Put another way, last year a large contraction in municipal waste hauling acted largely to counterbalance the anomalous surge in scrap metal hauling. This year a much smaller decline in municipal waste hauling is amplifying the return to prior trend in scrap metal hauling.
By contrast, here are the number of rail carloads for the remaining 7 weeks of the third quarter in 2010 and 2011 for scrap metals:
- 2010: 30,034
- 2011: 33,205
And here are the totals for the remaining 7 weeks for municipal waste:
- 2010: 27,612
- 2011: 24,320
In the last seven weeks of the third quarter last year, scrap metal hauling was only up +10.6%, and municipal waste was down -12.0%. So for the full quarter last year, the YoY increase of scrap metal and municipal waste combined was only +2.8%.
But the comparison of the first 6 weeks vs. the final 7 weeks of the third quarter last year -- which was huge -- isn't reflected in the graph.
Had the graph compared apples to apples, there would have been a huge increase last year balanced by an equal decrease this year. If you're not going to do that, then you have to wait to see how the entire third quarter plays out - which would deprive you of the trashy sexy graph of DOOM!
So here's the moral of the story of the alleged trash indicator: garbage in, garbage out.
Thursday, March 22, 2012
Disposing of the garbage from the King Report and Art Cashin
- by New Deal democrat
I dislike cherry-picking data. It almost always means that the writer started with a conclusion and reasoned backward to find support.
There is some particularly egregious cherry-picked garbage that started with the King Report; namely, that December 2011 through February 2012 non-seasonally adjusted data showed that we have lost 1.8 million jobs. Therefore, presumably, the jobs picture is actually quite bleak. This then got repeated by Art Cashin on CNBC.
Our former co-blogger Invictus eviscerated this claim over at Barry Ritholtz' Big Picture. For the record, beginning with December 2000, here is the December through February change in the non-seasonally adjusted payrolls survey:
2001 -2212
2002 -2402
2003 -2273
2004 -2050
2005 -1880
2006 -1728
2007 -2105
2008 -2519
2009 -3939
2010 -2432
2011 -2037
2012 -1801
Note that once we strip out the seasonal adjustments, the last two months of job data have been the best bar once in the last 12 years.
Apparently undeterred, when called on it, instead of just admitting he goofed (nobody's perfect after all), Cashin doubled down, claiming that he was simply following Lakshman Achuthan's lead in not accepting seasonal adjustments since the recession and looking at YoY data.
In the first place, Achuthan's rejoinder to my critism of ECRI's recent recession call defense - that recent seasonal adjustments following the 2008 recession may be overstating wintertime growth - besides being cherry-picking itself, since ECRI apparently has not historically primarily relied on this mode of measurement, overstates the conclusion that should be drawn. If we're not sure we can trust seasonal adjustments, and they conflict with YoY data, that does NOT mean we should accept the YoY data as the more reliable picture of the present condition. It means that WE DON'T KNOW which way of looking at the data is more accurate in depicting the present condition.
But let's accept Achuthan's criticism, and accept YoY nonfarm payrolls each February since 2000 as presenting the truer picture. Here's the result, again derived directly from the UN-seasonally adjusted data:
2001 1670
2002 -2028
2003 -409
2004 316
2005 2219
2006 2692
2007 1754
2008 715
2009 -5042
2010 -3568
2011 1402
2012 2016
On a YoY basis, the last 12 months have seen the 3rd best job growth in the last 12 years.
There is not a shred of credibility in the claim made by the King Report, the original Cashin claim, or the revised Cashin claim. Rather than repeating the claims at other business sites, it's time to throw out the garbage.
I dislike cherry-picking data. It almost always means that the writer started with a conclusion and reasoned backward to find support.
There is some particularly egregious cherry-picked garbage that started with the King Report; namely, that December 2011 through February 2012 non-seasonally adjusted data showed that we have lost 1.8 million jobs. Therefore, presumably, the jobs picture is actually quite bleak. This then got repeated by Art Cashin on CNBC.
Our former co-blogger Invictus eviscerated this claim over at Barry Ritholtz' Big Picture. For the record, beginning with December 2000, here is the December through February change in the non-seasonally adjusted payrolls survey:
2001 -2212
2002 -2402
2003 -2273
2004 -2050
2005 -1880
2006 -1728
2007 -2105
2008 -2519
2009 -3939
2010 -2432
2011 -2037
2012 -1801
Note that once we strip out the seasonal adjustments, the last two months of job data have been the best bar once in the last 12 years.
Apparently undeterred, when called on it, instead of just admitting he goofed (nobody's perfect after all), Cashin doubled down, claiming that he was simply following Lakshman Achuthan's lead in not accepting seasonal adjustments since the recession and looking at YoY data.
In the first place, Achuthan's rejoinder to my critism of ECRI's recent recession call defense - that recent seasonal adjustments following the 2008 recession may be overstating wintertime growth - besides being cherry-picking itself, since ECRI apparently has not historically primarily relied on this mode of measurement, overstates the conclusion that should be drawn. If we're not sure we can trust seasonal adjustments, and they conflict with YoY data, that does NOT mean we should accept the YoY data as the more reliable picture of the present condition. It means that WE DON'T KNOW which way of looking at the data is more accurate in depicting the present condition.
But let's accept Achuthan's criticism, and accept YoY nonfarm payrolls each February since 2000 as presenting the truer picture. Here's the result, again derived directly from the UN-seasonally adjusted data:
2001 1670
2002 -2028
2003 -409
2004 316
2005 2219
2006 2692
2007 1754
2008 715
2009 -5042
2010 -3568
2011 1402
2012 2016
On a YoY basis, the last 12 months have seen the 3rd best job growth in the last 12 years.
There is not a shred of credibility in the claim made by the King Report, the original Cashin claim, or the revised Cashin claim. Rather than repeating the claims at other business sites, it's time to throw out the garbage.
Wednesday, February 15, 2012
Economic Fog at DK
- by New Deal democrat
There is a typical Doom and Gloom diary on DK which of course immediately hit the Wreck List (it's probably at the top by now), which once again demonstrates the ease of cherry-picking bearish data.
I'm away from my ability to post graphs, but I wanted to point you to the problems with that post.
1. The Baltic Dry Index. This index was said by the same person to be part of The crashing of the Leading Indicators in July 2010. If you don't remember the double-dip recession of 2010, that's because it didn't happen. This diarist never mentions when the Baltic Dry Index is rising, only when it falls. And it's current decline isn't even remotely close to the decline it experience during the "great recession," as demonstrated in graphic form in a great smackdown by Joe Weisenthal of Business Insider.
3. Electricity Usage. This is a graph that comes from a gold-bug site, gata.org, where when it was posted it was roundly ridiculed. It is the type of graph which "proves too much." There were declines very similar to this past month's in January 2011, in spring 2003, and in 2005 when the last economic expansion was at its peak. Needless to say, in none of those cases did a recession ensue. Until we have an explanation for why "this time it's different," why should we think a recession is heralded now -- especially given the warm winter in many parts of the country (less need for gas or electric heat). (Update: Also, this diarist has been bearish for at least 3 years, so why wasn't this metric ever mentioned by the diarist when it was rising? Why is it only a worthwhile statistic now?)
3. Petroleum Usage. This graph also "proves too much." It shows a relentless strong decline since 2007. Have we not seen improvements in GDP, employment, income, sales, and production at least since the end of 2009? Apparently this graph was perfectly capable of plummenting for the last two years of growth, why would it be different now? In fact, there are many signs that Americans are embracing various forms of conserving gasoline (I hope to have a post up on that within the week) and this is the primary driver of the decline.
4. Housing prices. It is housing starts, not prices, that are the important driver of the economy. Building more new houses has a strong multiplier effect that filters through the economy over a 1 to 2 year period. That is why housing starts or permits are long leading indicators for both the Conference Board and ECRI. The price of houses themselves -- that show more and more signs of stabilizing nominally -- do not give us any particular window into whether economic activity will rise or fall. (Update: Meanwhile, housing starts and permits have been at 3 month highs in the last two months. I guess that wasn't worth mentioning either).
5. Labor participation rates. The notion behind this graph was thoroughly debunked by our own Silver Oz's post on Monday. We know that younger people are staying in school longer, and we know that even with the bump-up in Boomer participation, the force of demographics is driving much if not most of the labor participation data.
6. Withholding taxes. The graph posted is UNadjusted for the 2% payroll tax reduction of 2011. Unsurprisingly, over that year, the comparisons with the year before without adjusting for that loss deteriorated. In fact, if you go to Matt Trivisonno's blog, you can see an original of a graph looking just like the one at DK -- followed by a graph which DOES account for the change in wittholding. That graph was up 8% YoY as of November 2011. Since January 1, 2012, we haven't had to make YoY adjustments because the payroll tax has carried over. 28 reporting days into 2012, $232.2 billion has been collected vs. $208.9 billion in 2011, better than a 10% improvement. (Update: Again, why wasn't this statistic worth mentioning while, in the diarist's own graph, it was positive and rising? Why is it only worthwhile now?)
I know my economic analysis is boring, because I go back and look at the same indicators over and over and over again, and I try to faithfully report if they are positive or negative. It's remarkably easy to cherry-pick data that supports a strictly bullish or bearish case, but that doesn't make it correct. In fact there is a big negative in the economy right now that is totally overlooked by that diarist -- the fact that wages haven't kept up with inflation for more than the last 12 months. But the "dark clouds" unfortunately embraced by the choir at DK are in fact just fog.
P.S.: I don't have to "disprove" the diarist's graphs. The diarist is the one claiming they consitute economic "dark clouds." I have shown that they are consistent with any number of scenarious. Once again: why are they only noteworthy to that diarist when they are falling? Why wasn't he writing bullish diaries as the BDI, withholding taxes, and electricity usage, per his graphs, were going up?
There is a typical Doom and Gloom diary on DK which of course immediately hit the Wreck List (it's probably at the top by now), which once again demonstrates the ease of cherry-picking bearish data.
I'm away from my ability to post graphs, but I wanted to point you to the problems with that post.
1. The Baltic Dry Index. This index was said by the same person to be part of The crashing of the Leading Indicators in July 2010. If you don't remember the double-dip recession of 2010, that's because it didn't happen. This diarist never mentions when the Baltic Dry Index is rising, only when it falls. And it's current decline isn't even remotely close to the decline it experience during the "great recession," as demonstrated in graphic form in a great smackdown by Joe Weisenthal of Business Insider.
3. Electricity Usage. This is a graph that comes from a gold-bug site, gata.org, where when it was posted it was roundly ridiculed. It is the type of graph which "proves too much." There were declines very similar to this past month's in January 2011, in spring 2003, and in 2005 when the last economic expansion was at its peak. Needless to say, in none of those cases did a recession ensue. Until we have an explanation for why "this time it's different," why should we think a recession is heralded now -- especially given the warm winter in many parts of the country (less need for gas or electric heat). (Update: Also, this diarist has been bearish for at least 3 years, so why wasn't this metric ever mentioned by the diarist when it was rising? Why is it only a worthwhile statistic now?)
3. Petroleum Usage. This graph also "proves too much." It shows a relentless strong decline since 2007. Have we not seen improvements in GDP, employment, income, sales, and production at least since the end of 2009? Apparently this graph was perfectly capable of plummenting for the last two years of growth, why would it be different now? In fact, there are many signs that Americans are embracing various forms of conserving gasoline (I hope to have a post up on that within the week) and this is the primary driver of the decline.
4. Housing prices. It is housing starts, not prices, that are the important driver of the economy. Building more new houses has a strong multiplier effect that filters through the economy over a 1 to 2 year period. That is why housing starts or permits are long leading indicators for both the Conference Board and ECRI. The price of houses themselves -- that show more and more signs of stabilizing nominally -- do not give us any particular window into whether economic activity will rise or fall. (Update: Meanwhile, housing starts and permits have been at 3 month highs in the last two months. I guess that wasn't worth mentioning either).
5. Labor participation rates. The notion behind this graph was thoroughly debunked by our own Silver Oz's post on Monday. We know that younger people are staying in school longer, and we know that even with the bump-up in Boomer participation, the force of demographics is driving much if not most of the labor participation data.
6. Withholding taxes. The graph posted is UNadjusted for the 2% payroll tax reduction of 2011. Unsurprisingly, over that year, the comparisons with the year before without adjusting for that loss deteriorated. In fact, if you go to Matt Trivisonno's blog, you can see an original of a graph looking just like the one at DK -- followed by a graph which DOES account for the change in wittholding. That graph was up 8% YoY as of November 2011. Since January 1, 2012, we haven't had to make YoY adjustments because the payroll tax has carried over. 28 reporting days into 2012, $232.2 billion has been collected vs. $208.9 billion in 2011, better than a 10% improvement. (Update: Again, why wasn't this statistic worth mentioning while, in the diarist's own graph, it was positive and rising? Why is it only worthwhile now?)
I know my economic analysis is boring, because I go back and look at the same indicators over and over and over again, and I try to faithfully report if they are positive or negative. It's remarkably easy to cherry-pick data that supports a strictly bullish or bearish case, but that doesn't make it correct. In fact there is a big negative in the economy right now that is totally overlooked by that diarist -- the fact that wages haven't kept up with inflation for more than the last 12 months. But the "dark clouds" unfortunately embraced by the choir at DK are in fact just fog.
P.S.: I don't have to "disprove" the diarist's graphs. The diarist is the one claiming they consitute economic "dark clouds." I have shown that they are consistent with any number of scenarious. Once again: why are they only noteworthy to that diarist when they are falling? Why wasn't he writing bullish diaries as the BDI, withholding taxes, and electricity usage, per his graphs, were going up?
Subscribe to:
Posts (Atom)