-by New Deal democrat
The Federal Reserve's report on household debt burdens was released a week ago Friday, covering the April - June quarter. According to the bank,
The household debt service ratio (DSR) is an estimate of the ratio of debt payments to disposable personal income. Debt payments consist of the estimated required payments on outstanding mortgage and consumer debt.Both measures declined substantially again, after a relative pause in the last couple of quarters (which had shown less deleveraging before this quarter's revisions). I've combined the two measures into a single graph:
The financial obligations ratio (FOR) adds automobile lease payments, rental payments on tenant-occupied property, homeowners' insurance, and property tax payments to the debt service ratio.
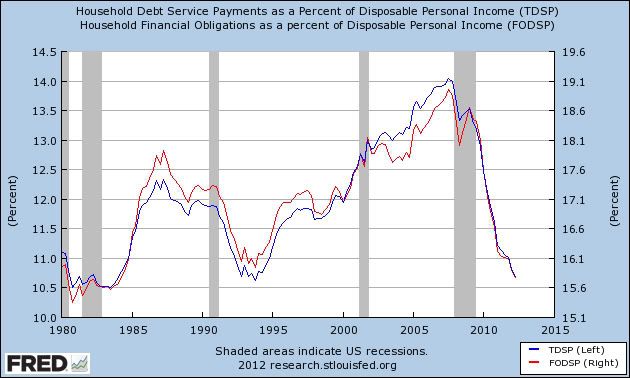
Debt service payments (blue line) are now less than all but one quarter - 4Q 1993 - since 1984. Total financial obligations (red line), are now less than at any since the second quarter of 1984.
If this rate of decline continues, then households will have lower debt burdens than at any time since both series started in 1980 in about 6 more months.
The New York Federal Reserve's Quarterly Report on Debt and Credit for the second quarter of 2012 showed that
Household indebtedness declined to $11.38 trillion, a $53 billion decline from the first quarter of 2012. Outstanding household debt has decreased $1.3 trillion since its peak in Q3 2008. The reduction was led by a decline in real estate-related debt like mortgages and HELOC....
"The continuing decrease in delinquency rates suggests that consumers are managing their debts better," said Wilbert van Der Klaauw, vice president and economist at the New York Fed. "As they continue to pay down debt and take advantage of low interest rates, Americans are moving forward with rebalancing their household finances."
The seemingly conflicting data on the relatively modest decline of overall debt, vs. the steep decline in financial obligations, is explained in large part by refinancing. Here is a graph, courtesy of Mortgage News Daily, of the volume of refinancing measured weekly in the past 5 years:
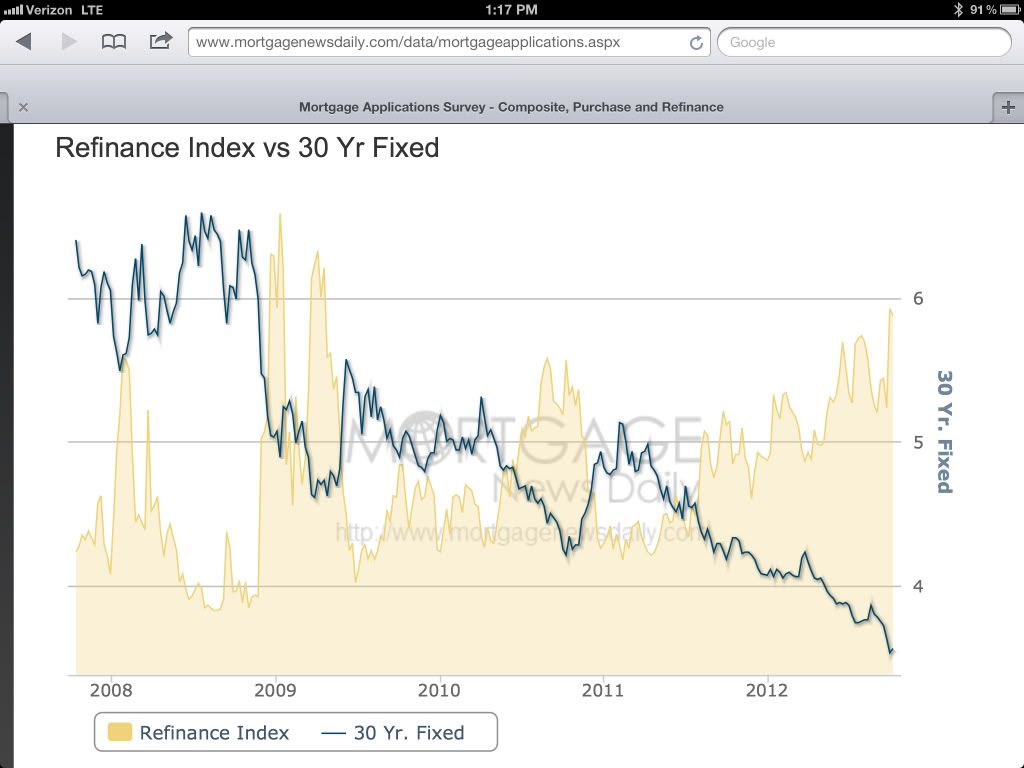
There has been a surge of refinancing as mortgage rates fell to and then under 4%. I continue to believe this is one of the main props holding up the economy, despite the decline in real wages.
----------------
UPDATE from CNBC this afternoon:
U.S. home owners are refinancing their mortgages at the fastest clip since 2005, but the difference now is they are putting cash in, not taking it out.This equates to about 0.6% of all retail spending per month.
At the going rate, 25 percent of all first-lien U.S. mortgages will be refinanced this year, according to LPS Applied Analytics. That represents about $7.1 billion —just through June of this year — in savings on monthly payments, according to economists at Freddie Mac, who ran the numbers for this report.