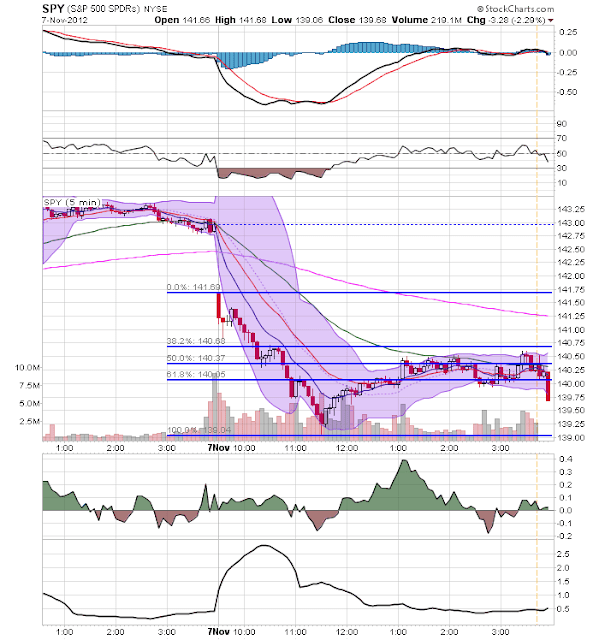
Given yesterday's sell-off -- and it's proximity to the election -- let's take a look at the US equity market over a series of several charts.
On the 5-minute chart, we see that prices gapped lower at the open, moved lower until lunch and then rallied until the close. The rally was stalled by the natural resistance that occurs at Fib levels. Look closely at the volume over the rally, which was lower than the sell-off. Also note the smaller candles and less severe nature of the rally. My guess is this is a technical purchasing rally.
On the 60 minute chart, notice that prices have fallen below the key support level of 141, which was established multiple times over the last two weeks.
On the daily chart, we see the importance of the 141 price level. Also note that prices have sold-off to Fib levels on very high volume. Also note the weakening MACD and CMF. On this chart, I'd target the 200 day EMA as the next price target.
The weekly chart (top chart) shows that prices are right at important support. The MACD is close to giving a sell-signal, the the CMF is strong. The monthly chart (bottom chart) is very concerning, as it indicates that prices are right at support for the long-term rally that started in 2011.


