Total US exports are actually at higher levels now than before the recession and have been in a clear uptrend (with the exception of recessions) for the last 40 years. Let's take a closer look at the data.
The chart above shows the last 5 years of data, and we see clearly that exports have overtaken previous levels and are now near all time highs.
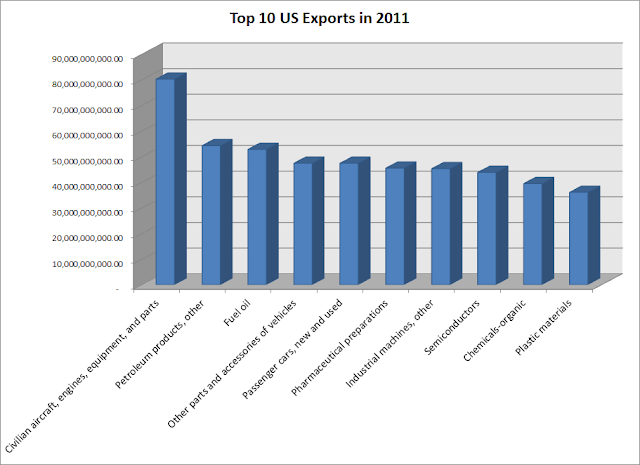
And here are two charts which show what we export:
Here is a list of the information in graphic form:
| Civilian aircraft, engines, equipment, and parts | 80,172,454,470.00 |
| Petroleum products, other | 54,237,010,317.00 |
| Fuel oil | 52,800,539,232.00 |
| Other parts and accessories of vehicles | 47,365,339,805.00 |
| Passenger cars, new and used | 47,354,593,365.00 |
| Pharmaceutical preparations | 45,468,815,842.00 |
| Industrial machines, other | 45,246,225,629.00 |
| Semiconductors | 43,773,152,276.00 |
| Chemicals-organic | 39,419,030,345.00 |
| Plastic materials | 36,025,994,150.00 |
| Telecommunications equipment | 35,849,294,688.00 |
| Electric apparatus | 35,118,902,366.00 |
| Nonmonetary gold | 33,228,280,326.00 |
| Medicinal equipment | 32,041,186,500.00 |
| Computer accessories | 31,567,258,172.00 |
| Minimum value shipments | 30,028,425,150.00 |
| Chemicals-other | 28,783,602,478.00 |
| Industrial engines | 28,102,493,451.00 |
| Measuring, testing, control instruments | 23,742,788,374.00 |
| Other industrial supplies |
22,985,042,545.00 |


