For the last two years, we've been pummeled with the concept that all this spending and the ever rising deficits will lead to our financial ruin. This was a central tenant to this falls elections. However, to fix the deficit, we're going to have to see two things happen: an increase in taxes and a decrease in spending -- with an emphasis on health care expenditures.
So -- in their first move of the new Congress, did we see a move to raise revenue to help stave off the imminent danger of federal deficit?
No.
We saw a "kick the can down the road' response to the problems we face.
As usual, Washington fell down on the job.
Tuesday, December 7, 2010
"Two Americas," Income Distribution and Education

Something that Ben Bernanke said in the 60 minutes interview has been sticking in my brain. When asked about income disparity, Bernanke commented on the current situation with the unemployment rate and educational achievement. To that end, consider this chart from Calculated Risk that shows the unemployment rate by educational achievement. Notice that the lower one's educational achievement, the higher the unemployment rate. Also notice the wide margin -- less education means a remarkably higher rate of unemployment. I realize that education is not the be all and the end all but it is obviously a very important factor in this equation.
Employment Thoughs
Consider the following chart of total private jobs:

Notice the private sector job situation actually turned faster after the latest recession compared to the previous two recession. However, the real issue is the amount of job losses that occurred during the recession -- notice the steep decline that occurred during the last recession.

Notice the private sector job situation actually turned faster after the latest recession compared to the previous two recession. However, the real issue is the amount of job losses that occurred during the recession -- notice the steep decline that occurred during the last recession.

Prices had an early morning rally (a), followed by a quick reversal bounded by two trend lines (b and c). This was followed by a grinding rally for most of the rest of the day (d). However, there was a strong sell-off at the end of trading (e).

Notice that prices are right at important resistance levels (a). However, yesterday prices did not make any upward progress.

Prices gapped higher at the open. But as is typical with that development, the MACD (d) indicated that all the momentum occurred at that one move (d). Prices moved down to the 50% retracement level (b) but rallied for the rest of the day (c).

The overall trend in the Treasury market is still lower (a), with prices forming a downward sloping pennant pattern. Also note the very bearish EMA picture -- all are moving lower, the shorter are below the longer and prices are below all of the EMAs.

Oil has overcome the technical resistance it encountered in the lower 80s (A). Prices have twice advanced strongly beyond this level (B and C). Notice that prices are now at important technical levels (C). Also note the MACD (D) has given a buy signal. At some point, oil can become a problem for the economy.

Gold has three trends. First, there is the strong uptrend (A) of prices followed by a triangle consolidation that moves sideways (B). This is followed by a strong upside breakout (C). Also note the MACD has given a buy signal (D).
Monday, December 6, 2010
No Really -- The Economy Is Doing Well
From the AP:
What's important here is the following:
1.) I'm not the only person who has noticed that the economy is doing well;
2.) In reality, there are a lot of reasons for economists to be optimistic.
The economy is starting to fire on almost every cylinder these days but the one that matters most: Job creation.
Factories are busier. Incomes are rising. Autos are selling. The holiday shopping season is shaping up as the best in four years. Stock prices are surging.
And many analysts are raising their forecasts for the economy's growth. Goldman Sachs, for instance, just revised its gloomy prediction of a 2 percent increase in gross domestic product in 2011 to 2.7 percent and forecast 3.6 percent growth for 2012.
"The upward momentum has more traction this time," says James O'Sullivan, chief economist at MF Global.
If only every major pillar of the economy were faring so well.
Despite weeks of brighter economic news, employers still aren't hiring freely. The economy added a net total of just 39,000 jobs in November, the government said Friday.
That's far too few even to stabilize the unemployment rate, which rose from 9.6 percent in October to 9.8 percent last month. Unemployment is widely expected to stay above 9 percent through next year, in part because of the still-depressed real estate industry.
What's important here is the following:
1.) I'm not the only person who has noticed that the economy is doing well;
2.) In reality, there are a lot of reasons for economists to be optimistic.
Bernanke On 60 Minutes
I remember when I was a kid, on Sunday nights the family would have dinner and watch 60 minutes. It was the only time we would watch TV at dinner. Back then, 60 minutes was "it." I don't know if it still is or not, but last night Bernanke was on 60 minutes. He seems to be engaging more -- which I think is very good, considering our political discourse is dominated by abject stupidity. I caught the last half of the interview. Here is the interview in its entirety.
November Jobs Report will probably be revised significantly higher
- by New Deal democrat
Take a deep breath. The November jobs report was either an outlier, or at least at the low end of the expected range of error in the trend. That's probably why the stock market shrugged it off on Friday. The odds are very good that it will be revised significantly higher in the next two months. Regardless, since the source of the problem was how to deal with seasonal retail hiring, the best view is to average the October and November reports together. That means even without upward revisions the economy added ~105,000 jobs a month in the last two months - and it is likely to look better within 60 days.
First of all, let's put this in perspective. Even though Friday's jobs report felt like a kick in the gut, at this time last year we were dealing with relentless job losses. November 2009 job losses had just preliminarily been reported as -11,000, and that was over 100,000 better than the next least-worst report. By contrast, here are the monthly jobs numbers (in thousands), excluding census, for 2010:
Every single 2010 jobs number has been positive. No, it's not enough to overcome population growth, which would require about 150,000 a month. Nor is it enough to really begin undoing the job losses of the Great Recession, which would probably require at least 300,000 a month. But excepting the summer slowdown, we have been moving in the right direction for a long time.
Secondly, we have been here before. Here is something Bonddad wrote after September 2009 had just been reported as showing -263,000 jobs lost, another "feel like I've been kicked in the gut" report:
Keep that thought in mind and consider the following: here is the change between initial and final jobs report for each month so far this year, with the net change (including census jobs, which have no impact on the result):
(p)=preliminary revision
Every single initial jobs report in 2010 except one has been revised higher. The median final revision of the Jan-Sep initial reports has been +53,000. All but two of the nine that have been finally revised have increased by at least +46,000. A revision of +53,000 to November would give us +92,000. Even if October is not revised any higher, the average of the two months would be +132,000, the best showing since March-April. If October were also revised up +53,000 from its initial report, that would be +204,000 for a two month average of +148,000 and a three month average of +136,000. In other words, just normal revisions in line with those previously this year would put us very close to the point where we are keeping up with population growth -- but we won't know that for sure for 2 more months.
And it is clear that, if November's report wasn't an outlier, than it was at the very low end of the range of error. Here is the update of the scatter graph of Initial Jobless Claims vs. Nonfarm Payrolls since the March 2009 high in claims:
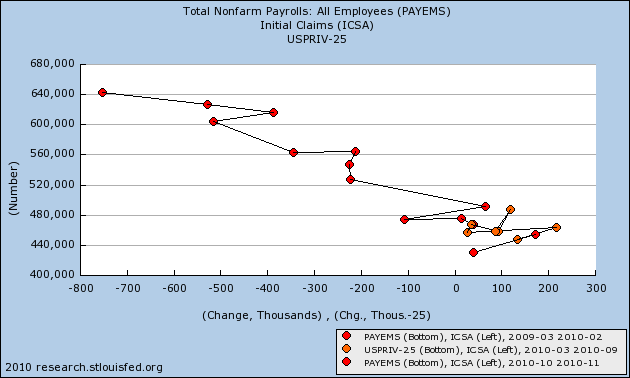
It is pretty clear that the initial November report comes in at the weakest point of the overall trend range.
Third, we know the source of the shortfall in the November report: retail hiring. Every month the BLS includes spreadsheets breaking out the data in their report. Schedule B breaks out the establishment report by type of job. Here is a screenshot of that portion of the spreadsheet dealing with service jobs:
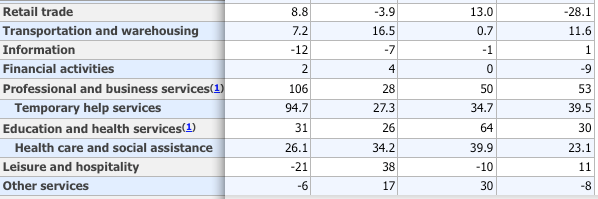
Look at the lines entitled "retail trade" and "other services." Had both of these been at the same levels as October, that would have added +80,000 jobs to the report! Further, compare November with the last two months, and with November last year. The monthly change in both series is significantly lower, retail dramatically so, than even last year when the economy was losing jobs.
So let's break out "retail sales" and "other services" (the two areas that were responsible for the big change between October and November) and take a closer look:
Here is the breakdown of the ultimate Seasonally Adjusted numbers, and m/m change:
First, here is "Other services:"
The median month over month gain for Jan-Sep was +11. If Oct and Nov simply followed that, (i.e., +11 and +11), then Oct overestimated by +19, but Nov's ultimate number is on the mark.
Now, here is "Retail trade:"
The median month over month gain in retail jobs for Jan-Sep was +7.1 If October and November simply added +7.1 each month, then October is too high by ~6, but November is WAY off. November is too low by ~30!
Another way of looking at this is that, according to the BLS, in November we gave back almost every single retail job we added since February. Further, the last time we gave back 30k or more jobs in one month was in October 2009. Is there anybody who thinks that really happened?
Just to check how big (or not) a role revisions to the "retail trade" number was in the overall revisions, I specifically checked the initial vs. final revised number for that item. Here is the result:
The median change for the "retail trade" series in the Jan-Sep 2010 revisions is only +4.5 thousand, meaning that if the November initial report missed big on retail positions, while not likely it is at least possible that in addition to a significant upward revision on the order of +50,000 for the other items in the initial November report, there could also be a big positive retail jobs revision .
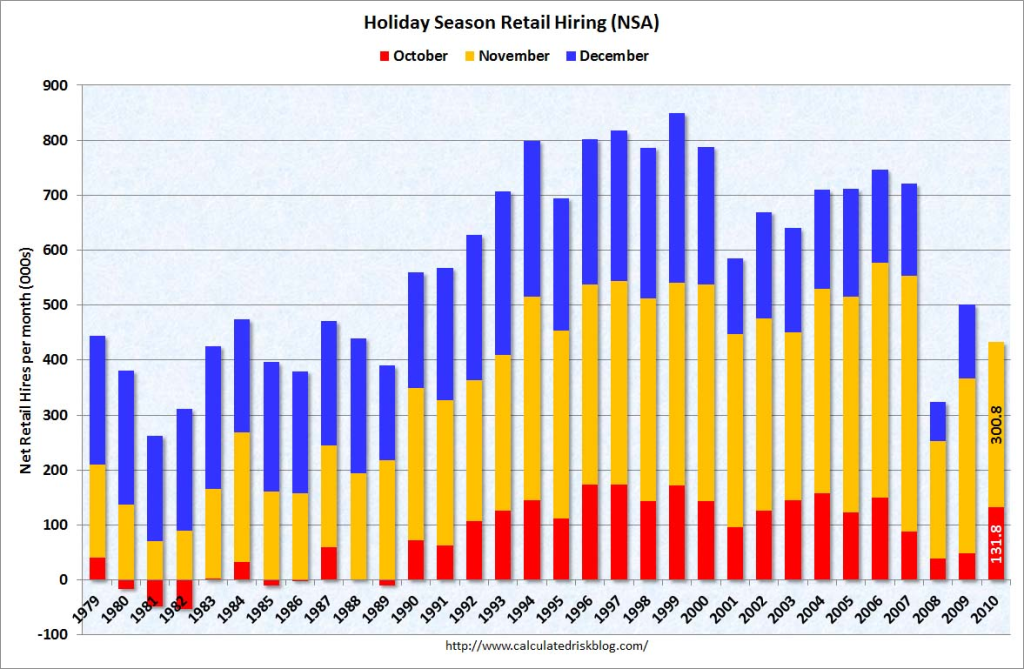
Fourth, it is adjusting for seasonal retail hiring that is the problem. Retailers hire a lot of temporary help for the holiday season. It is a known factor and so is automatically seasonally adjusted. But the adjustment can create outsized effects. In October, the BLS "expected" employers to hire about 118,800 retail employees. In fact they hired 131,800, so the Seasonally Adjusted number was +13,000. In November, the BLS "expected" employers to hire +328,900 retail employees, but they actually hired +300,800, so the inital Seasonally Adjusted number reported on Friday was -28,100.
This is the logic behind the following graph by Calculated Risk, showing non-seasonally adjusted October through December retail hiring for the past 30 years:
Contrast this with, for example, May, when the BLS "expects" employers to add 101.900 "retail trade" jobs, only about 1/3 of November's adjustment.
In short, relatively minor changes in employment plans at this time of year, because of seasonal adjustments, can have outsized effects. As a result, it is probably best to average October and November's reports, as I have done above, to deal with these effects.
Finally, let's bear in mind that both ADP and TrimTabs called for job gains of between 90,000 and 120,000 in November, and both have been consistently understating the BLS reports this year. A revision more in line with those reports would make sense.
In that regard, I have been favored by Matt Trivisonno with a YoY withholding tax graph from his Daily Jobs Update site, current through last week, which adjusts for the "making work pay" credit of the ARRA. It has been relentlessly improving:
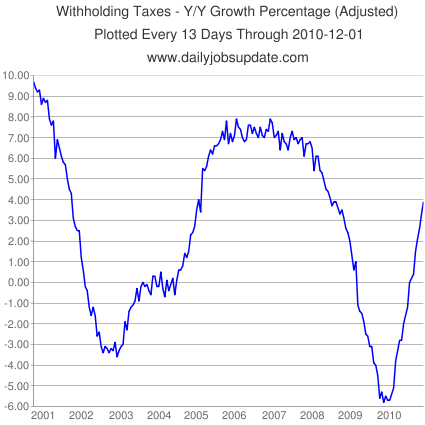
This graph has accurately tracked YoY aggregate hours worked in the past ten years, and is currently showing the same YoY% improvement it did at the end of 2004 -- when the economy was consistently adding 200,000 jobs a month.
Two caveats: On the other hand, a comparison of the Household Report and the Establishment Report, including Friday's numbers, shows that both have leveled off since the census began its layoffs in May. Furthermore, it cannot be denied that the Household Report has shown actual declines in the last two months, which were not affected by the census at all.
In addition to that very significant caution, bear in mind that the BLS has already told us that they are going to reduce the total jobs count for the 12 months between March 2009 and March 2010 by an average of 30,000 a month. This is very much a wild card. On the one hand, the September 2009 report mentioned at the outset of this post, after having been increased to -113,000, was knocked back down to -225,000 by the yearly adjustment announced this past February. On the other hand, the November 2009 report - the one and only positive report - was actually increased by 64,000 jobs in those yearly revisions. The BLS has historically underestimated job losses during recessions, and underestimated job gains in the first part of a recovery, so it is about equally possible that the revisions which will be announced in February 2011 will go either way.
Bottom line: it is likely, but not certain, that the November payrolls report will be revised significantly higher, and that we continue to move in the right direction. The best approach is to average the October and November reports for the truer trend, which even now is +105,000 each month.
Take a deep breath. The November jobs report was either an outlier, or at least at the low end of the expected range of error in the trend. That's probably why the stock market shrugged it off on Friday. The odds are very good that it will be revised significantly higher in the next two months. Regardless, since the source of the problem was how to deal with seasonal retail hiring, the best view is to average the October and November reports together. That means even without upward revisions the economy added ~105,000 jobs a month in the last two months - and it is likely to look better within 60 days.
First of all, let's put this in perspective. Even though Friday's jobs report felt like a kick in the gut, at this time last year we were dealing with relentless job losses. November 2009 job losses had just preliminarily been reported as -11,000, and that was over 100,000 better than the next least-worst report. By contrast, here are the monthly jobs numbers (in thousands), excluding census, for 2010:
| Month | Job gains |
|---|---|
| Jan | +5 |
| Feb | +23 |
| Mar | +160 |
| Apr | +147 |
| May | +21 |
| Jun | +50 |
| Jul | +77 |
| Aug | +113 |
| Sep | +53 |
| Oct | +172(p) |
| Nov | +39(p) |
Every single 2010 jobs number has been positive. No, it's not enough to overcome population growth, which would require about 150,000 a month. Nor is it enough to really begin undoing the job losses of the Great Recession, which would probably require at least 300,000 a month. But excepting the summer slowdown, we have been moving in the right direction for a long time.
Secondly, we have been here before. Here is something Bonddad wrote after September 2009 had just been reported as showing -263,000 jobs lost, another "feel like I've been kicked in the gut" report:
this is a clear step in the wrong direction. Considering the rate of job losses at the beginning of the year (600,000+/month) expecting an immaculate recovery is highly unrealistic. However, the bleeding has to stop at some point. So by the end of this year we have to be far lower than today's number for a recovery to be viable. Consumers cannot continue to hear news like this and expect to have a positive attitude about the economy. It's that simple.Two months later, that had been revised to -139,000, and November would ultimately be revised to +4,000, the first positive jobs report after the bottom of the Great Recession.
Keep that thought in mind and consider the following: here is the change between initial and final jobs report for each month so far this year, with the net change (including census jobs, which have no impact on the result):
| Month | Initial | Final | net change |
|---|---|---|---|
| Jan | -20 | +14 | +34 |
| Feb | -36 | +39 | +75 |
| Mar | +162 | +208 | +46 |
| Apr | +250 | +313 | +63 |
| May | +431 | +432 | +1 |
| Jun | -125 | -175 | -50 |
| Jul | -131 | -66 | +75 |
| Aug | -54 | -1 | +53 |
| Sep | -95 | -24 | +71 |
| Oct | +151 | +172(p) | +21(p) |
| Nov | +39 |
(p)=preliminary revision
Every single initial jobs report in 2010 except one has been revised higher. The median final revision of the Jan-Sep initial reports has been +53,000. All but two of the nine that have been finally revised have increased by at least +46,000. A revision of +53,000 to November would give us +92,000. Even if October is not revised any higher, the average of the two months would be +132,000, the best showing since March-April. If October were also revised up +53,000 from its initial report, that would be +204,000 for a two month average of +148,000 and a three month average of +136,000. In other words, just normal revisions in line with those previously this year would put us very close to the point where we are keeping up with population growth -- but we won't know that for sure for 2 more months.
And it is clear that, if November's report wasn't an outlier, than it was at the very low end of the range of error. Here is the update of the scatter graph of Initial Jobless Claims vs. Nonfarm Payrolls since the March 2009 high in claims:
It is pretty clear that the initial November report comes in at the weakest point of the overall trend range.
Third, we know the source of the shortfall in the November report: retail hiring. Every month the BLS includes spreadsheets breaking out the data in their report. Schedule B breaks out the establishment report by type of job. Here is a screenshot of that portion of the spreadsheet dealing with service jobs:
Look at the lines entitled "retail trade" and "other services." Had both of these been at the same levels as October, that would have added +80,000 jobs to the report! Further, compare November with the last two months, and with November last year. The monthly change in both series is significantly lower, retail dramatically so, than even last year when the economy was losing jobs.
So let's break out "retail sales" and "other services" (the two areas that were responsible for the big change between October and November) and take a closer look:
Here is the breakdown of the ultimate Seasonally Adjusted numbers, and m/m change:
First, here is "Other services:"
| Month | Jobs | month/month change |
|---|---|---|
| Jan | 5317 | +3 |
| Feb | 5310 | -7 |
| Mar | 5321 | +11 |
| Apr | 5333 | +12 |
| May | 5337 | +4 |
| Jun | 5330 | -7 |
| Jul | 5352 | +22 |
| Aug | 5363 | +11 |
| Sep | 5410 | +17 |
| Oct | 5402(p) | +30(p) |
| Nov | 4319(p) | -8 (p) |
The median month over month gain for Jan-Sep was +11. If Oct and Nov simply followed that, (i.e., +11 and +11), then Oct overestimated by +19, but Nov's ultimate number is on the mark.
Now, here is "Retail trade:"
| Month | Jobs | month/month change |
|---|---|---|
| Jan | 14409.1 | +49.1 |
| Feb | 14416.2 | +7.1 |
| Mar | 14438.9 | +22.7 |
| Apr | 14453.3 | +14.4 |
| May | 14447.5 | -5.8 |
| Jun | 14431.3 | +16.2 |
| Jul | 14442.4 | +11.2 |
| Aug | 14448.8 | +6.4 |
| Sep | 1444,9 | -3.9 |
| Oct | 14457.9(p) | +13.0(p) |
| Nov | 14429.8(p) | -28.1(p) |
The median month over month gain in retail jobs for Jan-Sep was +7.1 If October and November simply added +7.1 each month, then October is too high by ~6, but November is WAY off. November is too low by ~30!
Another way of looking at this is that, according to the BLS, in November we gave back almost every single retail job we added since February. Further, the last time we gave back 30k or more jobs in one month was in October 2009. Is there anybody who thinks that really happened?
Just to check how big (or not) a role revisions to the "retail trade" number was in the overall revisions, I specifically checked the initial vs. final revised number for that item. Here is the result:
| Month | Initial | Final | net change |
|---|---|---|---|
| Jan | 42.1 | 49.1 | +7.0 |
| Feb | -0.4 | +7.1 | +7.5 |
| Mar | 14.9 | 22.7 | +7.8 |
| Apr | 12.4 | 14.4 | +2.0 |
| May | -6.6 | -5.8 | +0.8 |
| Jun | -6.6 | -16.2 | -10.2 |
| Jul | 6.7 | 11.2 | +4.5 |
| Aug | -4.9 | +6.4 | +11.3 |
| Sep | 5.7 | -3.9 | -9.6 |
| Oct | 27.9 | 13.0 | -14.9(p) |
The median change for the "retail trade" series in the Jan-Sep 2010 revisions is only +4.5 thousand, meaning that if the November initial report missed big on retail positions, while not likely it is at least possible that in addition to a significant upward revision on the order of +50,000 for the other items in the initial November report, there could also be a big positive retail jobs revision .
Fourth, it is adjusting for seasonal retail hiring that is the problem. Retailers hire a lot of temporary help for the holiday season. It is a known factor and so is automatically seasonally adjusted. But the adjustment can create outsized effects. In October, the BLS "expected" employers to hire about 118,800 retail employees. In fact they hired 131,800, so the Seasonally Adjusted number was +13,000. In November, the BLS "expected" employers to hire +328,900 retail employees, but they actually hired +300,800, so the inital Seasonally Adjusted number reported on Friday was -28,100.
This is the logic behind the following graph by Calculated Risk, showing non-seasonally adjusted October through December retail hiring for the past 30 years:
Contrast this with, for example, May, when the BLS "expects" employers to add 101.900 "retail trade" jobs, only about 1/3 of November's adjustment.
In short, relatively minor changes in employment plans at this time of year, because of seasonal adjustments, can have outsized effects. As a result, it is probably best to average October and November's reports, as I have done above, to deal with these effects.
Finally, let's bear in mind that both ADP and TrimTabs called for job gains of between 90,000 and 120,000 in November, and both have been consistently understating the BLS reports this year. A revision more in line with those reports would make sense.
In that regard, I have been favored by Matt Trivisonno with a YoY withholding tax graph from his Daily Jobs Update site, current through last week, which adjusts for the "making work pay" credit of the ARRA. It has been relentlessly improving:
This graph has accurately tracked YoY aggregate hours worked in the past ten years, and is currently showing the same YoY% improvement it did at the end of 2004 -- when the economy was consistently adding 200,000 jobs a month.
Two caveats: On the other hand, a comparison of the Household Report and the Establishment Report, including Friday's numbers, shows that both have leveled off since the census began its layoffs in May. Furthermore, it cannot be denied that the Household Report has shown actual declines in the last two months, which were not affected by the census at all.
In addition to that very significant caution, bear in mind that the BLS has already told us that they are going to reduce the total jobs count for the 12 months between March 2009 and March 2010 by an average of 30,000 a month. This is very much a wild card. On the one hand, the September 2009 report mentioned at the outset of this post, after having been increased to -113,000, was knocked back down to -225,000 by the yearly adjustment announced this past February. On the other hand, the November 2009 report - the one and only positive report - was actually increased by 64,000 jobs in those yearly revisions. The BLS has historically underestimated job losses during recessions, and underestimated job gains in the first part of a recovery, so it is about equally possible that the revisions which will be announced in February 2011 will go either way.
Bottom line: it is likely, but not certain, that the November payrolls report will be revised significantly higher, and that we continue to move in the right direction. The best approach is to average the October and November reports for the truer trend, which even now is +105,000 each month.
Sunday, December 5, 2010
Yesterday's Market

Considering the disappointment from of the jobs report, Friday's chart is actually decent. Prices moved sideways for most of the day, consolidating in a rectangle pattern (a). Prices broke out in the late afternoon, trading right on top of important levels (b), before moving higher into the close on increasing volume (c).

On the daily chart, prices are right at important resistance levels (a). Also note the EMA picture is bullish (b). The A/D and CMF confirm that more money is moving into the market right now (c and d) and the MACD has given a bullish buy signal (e).

First, on the IEF chart, notice that prices have continued to run into upside resistance at the EMAs and Fibonacci levels.

Treasury prices gapped higher at the open (a), but fell quickly and sharply. They attempted to rally (b) but the MACD indicated the rally was on weakening momentum (c). Prices continued to move lower throughout the rest of the trading day, hitting resistance at the EMAs.

Treasury prices continue to move lower (a) with the EMAs printing a very bearish picture. Also note that money is flowing out of the market (b and c) and momentum is clearly bearish (d).

After breaking the upside trend (a) and moving lower for two days (b), the dollar gapped lower on Friday (c).

Prices hit upside resistance at the 200 day EMA (a) and have since moved lower (a). Prices are now finding support at the 50 day EMA (b). Note the A/D line has printed lower (c) and the CMF is also showing money moving out of the market. Also note the MACD is also about to print a sell signal (e).
Friday, December 3, 2010
Weekend Weimar and Beagle
It's that time of the week .... we'll be back on Monday

Mr$. Bonddad and I were out of town last week, so we had friends watch the house. We left a 12-pack for our nephew, which Sarge knocked off the kitchen island. However -- he sacrificed his paw for the beer. Anything for the beer. He's fine now.


Mr$. Bonddad and I were out of town last week, so we had friends watch the house. We left a 12-pack for our nephew, which Sarge knocked off the kitchen island. However -- he sacrificed his paw for the beer. Anything for the beer. He's fine now.


Weekly Indicators: New Deal democrat smackdown Edition
- by New Deal democrat
On Wednesday, some commenter named "New Deal democrat" took up Prof. Brad Delong on a bet at his blog. Prof. Delong said, based on the ADP report, that less than 130,000 jobs would be added in November. This eeedjyut NDD threw a dart and predicted +190,000. So, this week's big number had to be the very disappointing +39,000 jobs report this morning. U-3 unemployment went back up to 9.8%. The average workweek declined -0.1 hours. Overtime was flat. The manufacturing workweek, one of the ten LEI, was also flat.
In addition to 11,000 workers laid off in government, there were another 15,000 laid off in manufacturing, and 28,100 lost in retail. Government losses, alas, were expected. Manufacturing losses are probably the coincident fruits of the decline in the manufacturing component of the LEI over the summer.
All was not bleak. YoY hourly earnings were up 1.6%. Aggregate hours worked increased 0.1%. Much more importantly, both September's and October's numbers were revised higher - a pattern that has persisted now for 11 of the last 12 months. September's original report of -95,000 including census losses has been revised upward +71,000 in the last two months to -24,000. October's good report was also revised up to +172,000. Last month, the final revisions to August turned that report, which also included census losses, from -54,000 to -1,000, a gain of +53,000.
Since the NFP report today seems to contradict the flood of good new reports we've seen in the last months, why do I suspect that in two months' time this report will look substantially different? I may yet have my revenge on Prof. Delong!
(Seriously, I do expect that this report will be revised substantially upward. More Monday.)
Now let's take a look at this week's high frequency data:
Gas at the pump declined two more cents to $2.86 a gallon. This is about $0.15 above its average from a few months ago. A barrel of Oil increased to $86 this week. Gasoline usage reamins lower than last year, 8.867 B gallons vs. 8.943 B a year ago. Gasoline stocks are still back into their normal range for this time of year. Over the longer term, gasoline usage still remains about 5% below its rate from the first half of the past decade.
The Mortgage Bankers' Association reported that its seasonally adjusted Purchase Index increased 1.1% last week, rising to a another post-April high, and for the first time in ages actually exceeed its level of a year ago, by 2.7%. Meanwhile, the Refinance Index came to an abrupt halt, decreasing 21.6% from a week ago, showing the dramatic effect of increased mortgage rates (to which this index is, not surrisingly, very sensitive).
The BLS reported 436,000 new claims. The 4 week moving average fell to 431,000. Five of the last six weeks have shown 440,000 or fewer new claims. It certainly appears that we are moving into a lower range.
The ICSC reported same store sales for the week ending November 27 increased 3.5% YoY, the best showing in several months, and were also up 0.5% week over week. Shoppertrak reported that "Black Friday weekend" sales were flat compared with last year.
Railfax for the fourth week in a row showed a slight decline in the advance over last year's loads for all sectors. Motor vehicles and housing materials remained slightly ahead of last year's rate. I understand that retailers ordered holiday shipments early this year, because of bottlenecks and delayed shipping last year, so a word of caution about over-interpreting the recent relative decline.
The American Staffing Association reported for the week ending November 20 another increase to 101.0. This metric now exceeds every other year for the same week except 2007. In the next few weeks this index will decline substantially, but the question will be how far in comparison with last year.
M1 was up 1% for the week, up 2.3% vs. last month, and +8% YoY, meaning "real M1" is up 6.8%. M2 was up less than 0.1%for the week, 0.4% vs. last month, and 3.2% YoY, meaning "real M2" is up 2.0%. Real M2 is not going down, but it is making very little progress towards breaking out of the "red zone" below +2.5% YoY.
Weekly BAA commercial bond rates decreased 0.08% last week back to 5.95%. This compares with yields on 10 year bond yields down-.05%. This does not indicate any stress on corporate bonds.
The Daily Treasury Statement showed that this year set a new record for November tax recesipts, at $138.9 B in receipts vs. $127.7 B a year ago, a gain of 11.2 B or 8.9% (but bear in mind there was one more reporting day this year than last. Nevertheless, this November's pace set a new record for the month, 2.0% above the previous record from November 2007 (which is less than the 4.6% inflation since then). Since the real, seasonally adjusted bottom in tax receipts took place no later than October 2009, this also marks the first advance over an increasing absolute number from a year before.
Finally ... my post yesterday about DK certainly hit a nerve, as there have been over 20 comments. If you haven't, I encourage you to read them all. One of the reasons I added the "recent comments" section at the right is so that commenters could continue to discuss something after it has scrolled out of view, so feel free to do so. Obviously, you are not alone. And to those who said that after Bonddad left, there was no more decent discussion of the economy on DK ... errmmm, {{clearing throat}}... personally, I feel insulted. But have a nice weekend!
More Thoughts on the Employment Report
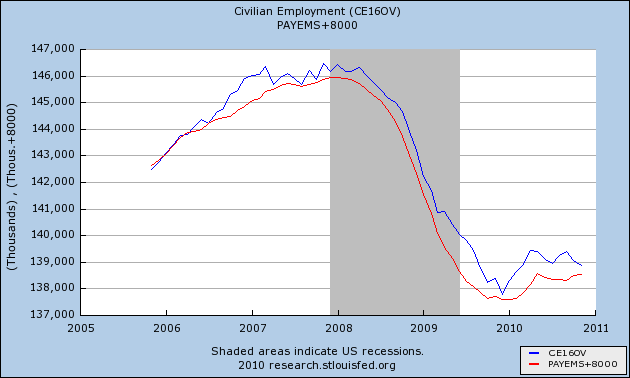
First, consider this chart:

The last six months have been extremely disappointing from an employment perspective. While we saw nice increases before that time, since then total establishment job growth has been fluctuating right around 0. Last month we printed over 150,000, and this month we saw a mere 39,000 -- a clear deceleration.
This is especially concerning considering the improvement we've seen over the last month. As I've been noting all week, and as reported in the latest Beige Book -- the last month we've seen a good improvement across the board in a variety of economic sectors.
The question is why the slowdown?
Here are some thoughts, in no particular order of importance.
1.) We've only recently seen a pick-up in economic activity and numbers. The previous Beige Book indicated the economy was weakening. In other words, there hasn't been enough improvement, especially in light of the slowdown we saw over the summer as a result of the EU situation.
2.) Companies are printing strong profit numbers without new hiring; from their perspective, there is no need for new employees.
3.) There isn't enough domestic growth (US based growth) to warrant the new hiring
4.) The legal uncertainty argument: the changes we've seen in the laws are extremely complicated and one (health care) has a direct bearing on hiring decisions. Until companies have sorted out the ramifications of these changes (and as soon as regulations are actually written) then we'll see an increase.
5.) There is still uncertainty about the future; that is, there is still enough concern about future growth prospects to put a freeze on big hiring plans.
6.) We're still seeing enough problems from Europe to raise enough concern about the future.
NFP + 39,000, Unemployment Rate +9.8%
From the BLS:
This is extremely disappointing, especially in light of the ADP employment numbers and the improving situation in the initial jobless claims market.
Let's start with the household survey.
The civilian labor force (the denominator in certain calculations) was essentially unchanged, moving from 153,904 to 154,007. The total employed decreased from 139,061 to 138,888, or a decrease of 173,000 This led to a decrease in the employment/population ratio from 58.3% to 58.2%. The total number of unemployed increased from 14,843 to 15,119, or an increase of 276,000. This lead to the increase in the unemployment rate from 9.6% to 0.8%. So, according to the household survey, there was a decrease in employment and an increase in unemployment over a steady sized population. Basically, this is the worst case scenario for the employment situation.
Let's move to the establishment survey:
Total private hiring increased 50,000. Goods producing industries decreased 15,000 while services increased 65,000. Most of this gain came from professional and business employment, which increased 53,000, while health care and education employment increased 30,000.
Average weekly hours were unchanged at 34.3 hours, but average hourly earnings increase a penny, which in turn increased average weekly earnings.
Again, this report is a big disappointment, especially considering the momentum increase in the employment situation. On a scale of 1 to 10, I'd give this report a 3. Some jobs were created and earnings did increase, but we're still stuck in the barely growing employment situation we were in before.
A note to commenter Bobby: the original post had far to many typos. Thanks for the catch and I will work on that in the future.
The unemployment rate edged up to 9.8 percent in November, and nonfarm payroll employment was little changed (+39,000), the U.S. Bureau of Labor Statistics reported today. Temporary help services and health care continued to add jobs over the month, while employment fell in retail trade. Employment in most major industries changed little in November.
This is extremely disappointing, especially in light of the ADP employment numbers and the improving situation in the initial jobless claims market.
Let's start with the household survey.
The civilian labor force (the denominator in certain calculations) was essentially unchanged, moving from 153,904 to 154,007. The total employed decreased from 139,061 to 138,888, or a decrease of 173,000 This led to a decrease in the employment/population ratio from 58.3% to 58.2%. The total number of unemployed increased from 14,843 to 15,119, or an increase of 276,000. This lead to the increase in the unemployment rate from 9.6% to 0.8%. So, according to the household survey, there was a decrease in employment and an increase in unemployment over a steady sized population. Basically, this is the worst case scenario for the employment situation.
Let's move to the establishment survey:
Total private hiring increased 50,000. Goods producing industries decreased 15,000 while services increased 65,000. Most of this gain came from professional and business employment, which increased 53,000, while health care and education employment increased 30,000.
Average weekly hours were unchanged at 34.3 hours, but average hourly earnings increase a penny, which in turn increased average weekly earnings.
Again, this report is a big disappointment, especially considering the momentum increase in the employment situation. On a scale of 1 to 10, I'd give this report a 3. Some jobs were created and earnings did increase, but we're still stuck in the barely growing employment situation we were in before.
A note to commenter Bobby: the original post had far to many typos. Thanks for the catch and I will work on that in the future.
Yesterday's Market

Yesterday, the markets opened with a strong rally (a) that eventually changed into a sideways market that consolidated in to rectangles (b and c). As with Wednesday's trading, notice that the MACD spiked in the AM with the rally but then moved lower for the rest of the day. This is a fairly standard development for this indicator on early spike days.

On the daily chart, notice that prices are continuing to move beyond the resistance line (a).

On the daily chart of the IWMs (the Russell 2000), notice that prices have moved through resistance (a) with a strong bar. Also notice the EMA position (a) -- the shorter EMAs are about the longer EMAs, all the EMAs are moving higher and prices are above the EMAs. This is important because the IWMs represent risk capital -- money that is more oriented towards capital gain rather than gain and dividends. As such, this move confirms that upward move of the SPYs.

Also note the transports are printing a chart similar to the IWMs, adding further confirmation to the upward move we're seeing in the equity markets.

The dollar has clearly broken its uptrend (a) and is now moving lower in a downward sloping channel (b). Notice that within the channel there are several strong downward moves (c), indicating selling pressure is fairly strong right now.

On the dollar's daily chart, notice that prices hit resistance at the 200 day EMA (a) but are now moving lower. This lower move coincides with a possible easing of stresses in the EU region, adding fundamental downward pressure on the dollar.
Thursday, December 2, 2010
Beige Book Shows A Decent Picture Of the Economy
Over the last week, I've looked at several major sectors of the U.S. economy (see here, here, here, and here). The purpose of this has been to demonstrate the economy is actually in better shape then previously thought. In addition, this week we've had some incredibly good numbers come out -- Chicago PMI printed some of its strongest numbers in over two years, auto sales were good, the ISM manufacturing numbers were good, and the ADP employment report was decent. The only bad news was the case shiller price index, which showed a decrease in home prices.
To sum it all up, here is the latest Beige Book from the Federal Reserve, which shows all of the above.
Here's the bottom line: the economy is in pretty decent shape right now. There are two problem areas: housing and jobs. Housing will be a problem child for some time because of excess supply, but there are signs the employment picture is getting better (making tomorrow's jobs report all that much more important).
To sum it all up, here is the latest Beige Book from the Federal Reserve, which shows all of the above.
Reports from the twelve Federal Reserve Districts indicate that the economy continued to improve, on balance, during the reporting period from early/mid-October to mid-November. Economic activity in the Boston, Cleveland, Atlanta, Dallas, and San Francisco Districts increased at a slight to modest pace, while a somewhat stronger pace of economic activity was seen in New York, Richmond, Chicago, Minneapolis, and Kansas City. Philadelphia and St. Louis reported business conditions as mixed.Manufacturing activity continued to expand in almost all Districts, with relatively strong growth seen in metal fabrication and the automotive industries. Reports also showed steady to increasing activity for professional and nonfinancial services. Two Districts noted a decline in demand from government agencies due to budgetary shortfalls. Reports on consumer spending tended to be positive. Nonetheless, several Districts noted that households remain price sensitive and focused on buying necessities. Expectations for the holiday shopping season were generally positive, with several Districts expecting higher sales when compared to year-ago levels. Sales of new cars and light trucks were largely higher than in our last report. Tourism improved in all reporting Districts.
Housing markets remain depressed, with several Districts reporting further weakening during the past six weeks. Conditions in commercial real estate were mixed, and activity stayed at low levels. Agricultural conditions were generally favorable, with several Districts reporting yields nearing historic highs. Agricultural sales to off-shore buyers increased. Overall activity in the energy sector continued to expand.
Lending activity remained stable across most Districts. Credit quality has been steady to improving for most of the Districts that commented on it. Prices for final goods and services were fairly stable, despite rising input costs, especially for agricultural commodities, metals, and fuel. Hiring activity showed some improvement across most Districts. Wage pressures were contained.
Here's the bottom line: the economy is in pretty decent shape right now. There are two problem areas: housing and jobs. Housing will be a problem child for some time because of excess supply, but there are signs the employment picture is getting better (making tomorrow's jobs report all that much more important).
And so, at long last, Daily Kos "economic analysis" goes completely insane
- by New Deal democrat
If you are not interested in left wing political blogs, or don't know anything about the blog Bonddad and I come from, or have no interest in Confirmation Bias, just pass on. This post shouldn't concern you. I promise that boring data analysis will resume shortly.
If you are not interested in left wing political blogs, or don't know anything about the blog Bonddad and I come from, or have no interest in Confirmation Bias, just pass on. This post shouldn't concern you. I promise that boring data analysis will resume shortly.
-----------
Watching an old friend or family member sink into alcoholism, psychosis. or some other self-destruction is sad, but at some point you half to accept that they are lost to insanity. Yesterday Daily Kos reached that point. The issue goes way past the issue of a blog post being right or wrong, but rather of economic blogging that isn't a laughingstock. Sadly, it is clear that the largest number of participants there have completely abandoned the ability or desire to think critically when it comes to the economy, and are so invested in bad news that any story, no matter how nonsensical, that fits into that narrative, will be showered with accolades.
At 2:17 am Pacific time yesterday, a writer posted an entry including the following lede:
This is a major, breaking story of first magnitude if true. One of the country's largest banks is possibly going to be bankrupt within days, due - according to the writer - to a NJ lower court decision about foreclosures, or publication next year by Wikileaks of some internal emails.
The story swiftly became the top-ranked post on that site, and stayed there for hours. Hundreds of people recommended it and over 500 commented about it.
Not one of those hundreds of people questioned its premise.
Not for a full 9 hours and 11 minutes until a poster named Papicek who has occasionally commented here as well, put up the following:
It isn't the first time that writer has been wrong. It isn't even the 20th or 50th. In fact, it isn't even the first time his prediction of Doom due to a corporation going bankrupt has been wrong. Over a year in May 2009 he claimed that there were going to be
At 2:17 am Pacific time yesterday, a writer posted an entry including the following lede:
... (you probably will start noticing it in the MSM soon, if not this morning), it appears that over the past 18 hours our country's largest bank, Bank of America, may have entered into the final stage(s) of a fairly swift implosion. Obviously, the economic, political and social implications of an event of this nature and magnitude occurring right now--if it does continue along its apparent trajectory even for a few more days--are nothing less than horrific.(my emphasis)
....
Yesterday, MSM and blog stories started surfacing concerning two separate issues ... with either one providing more than sufficient cause to drive the two-trillion-dollar behemoth into receivership, or worse--that place where almost all divine oligarchic institutions have gone of late: taxpayer exponential bailout hell.
This is a major, breaking story of first magnitude if true. One of the country's largest banks is possibly going to be bankrupt within days, due - according to the writer - to a NJ lower court decision about foreclosures, or publication next year by Wikileaks of some internal emails.
The story swiftly became the top-ranked post on that site, and stayed there for hours. Hundreds of people recommended it and over 500 commented about it.
Not one of those hundreds of people questioned its premise.
Not for a full 9 hours and 11 minutes until a poster named Papicek who has occasionally commented here as well, put up the following:
DJIA is up 249.76 points today and I've yet to hear anything on this from CNBC. If BoA's in trouble and it hits the MSM, it'll hit the markets hard, unless BoA has one of those special lending facilities sweetheart lines of credit available from Treasury, the Fed and/or the FDIC.
So far, all I'm hearing is market rally cheerleading on CNBC.
BTW, Bob Pisani reports that the market buzz is that all the Bush tax cuts will be extended. So, it looks like the US Chamber of Commerce Brotherhood of Thieves and Pickpockets think they're going to get what they paid for from the GOP and corpradems.
BAC shares went up 0.34 today as well, as did all 30 Dow companies.
Another two hours passed, and then a poster named Escamillo said:
You guys should take advantage by shorting BoA stock. It's not just rich fat cats that are "investors", normal people are as well, and you can be too. And if you guys are so sure that BoA is going to tank, you'd be a bunch of saps not to take advantage.
To me, this diary smells like wishful thinking in the guise of objective analysis, but for those of you taking this diary as objective truth, you can make a huge killing.
I know that there are many people who read both that blog and this one. If you do, riddle me this:
If Bank of America is potentially within days of going bankrupt, and its stock going to zero, why are the following statements all true?
- that possibility was never mentioned on CNBC.
- it was never mentioned on Bloomberg
- it was never mentioned on CNN Money
- it was never mentioned on the Calculated Risk blog
- it was never mentioned on The Big Picture blog
- it was never mentioned at Seeking Alpha (investment site)
- it was never mentioned on Mish's blog (and Mish has been a Doomer for ages)
- it was never mentioned at The Automatic Earth (uber Doomers)
- it was never mentioned at Zero Hedge (specializing in short selling stories)
- it was never mentioned at Financial Armageddon (another Doomer site)
- not one short seller like Bill Fleckenstein wrote an article nor appeared on any financial channel to try to panic investors so that they could cash in their short positions for a hefty profit.
In short, why was the first - and only - person who broke this First Order Magnitude Story somebody who has no particular investing acumen, who has no financial position, who is not an economist or advisor, but rather an obscure public relations flak who apparently has a small credit-checking business on the side?
Because the story is ludicrous, that's why. The story was based on a major factual error by the writer. He relied upon this Business Insider story that said that BofA shares were down 1.7% on Tuesday, and misread it as 17%. With that mistake, he assumed BofA was beginning a death spiral. Even though ultimately his factual error was pointed out to him, all he did was delete the reference, but he did not change his story at all - even though its premise was completely undercut.
And so invested in any story of Doom were his hundreds of readers that it never dawned on them that the story might be wrong. They made it the number 1 story for hours on end at a supposedly "reality-based" site.
This isn't about whether the economy is "good" or not. It is close to the worst level in 70 years. This also isn't about whether the economy is "improving" or not, and for what percentages of people, although I think the evidence is that it is improving for most people who are employed. Further, I claim no special knowledge of BofA. Who knows what unknown events might lurk in the future.
No, this is about basic rationality. BofA isn't going bankrupt because of Wikileaks, nor because of some lower state court decision about foreclosure improprieties. And it is absolutely not going bankrupt in the next week.
It isn't the first time that writer has been wrong. It isn't even the 20th or 50th. In fact, it isn't even the first time his prediction of Doom due to a corporation going bankrupt has been wrong. Over a year in May 2009 he claimed that there were going to be
upcoming six-figure job losses certain to occur throughout the auto industrydue to the presumed liquidation and disappearance of both General Motors and Chrysler.
The long, long record of blown predictions by that writer isn't even the point any more. Rather, the slightest amount of critical analysis would have led one to the questions finally posed by Papicek a full 9 hours after the story was published. But no such critical analysis was to be found, and those who could provide it no longer will do so at that site.
At at some time you go beyond simply being wrong to being looney. Not just the writer, but all those who were so psychologically invested in bad news that they uncritically accepted and endorsed yesterday's lunacy, have reached that point.
At at some time you go beyond simply being wrong to being looney. Not just the writer, but all those who were so psychologically invested in bad news that they uncritically accepted and endorsed yesterday's lunacy, have reached that point.
U.S. Economic Status,Part IV: Employment
While the unemployment rate is concerning, it's important to note the current experience is hardly new; in fact, we've been here after each recession since the mid 1970s recession.

Note that after the mid-1970s recession, unemployment hit 9%. After four years it dropped to 6%, but never hit 5% -- the level most economists use to describe full employment.

After the second recession of the early 1980s, unemployment was nearly 11%. It took over 5 years to get back to "full employment."

After the early 1990s recession, unemployment rose to over 7.5%. Again, it took over five years to get back to full employment.

Although the unemployment rate increased after the early 2000s recession, it didn't hit very high levels. But like the last three recoveries, it took a long time (as in nearly four years) for the unemployment rate to drop.
This commonality with previous recoveries does not make the current situation any easier, and should not be used as justification for doing nothing. However, it is important to remember we've been here before.
Initial unemployment claims have remained at a stubbornly annoying high level for the better part of the year. However, this is not the first time we have seen this behavior from initial claims.

Notice in the above graph of initial claims there have been two different types of "recoveries" in initial unemployment claims; fast recoveries that occurred before the early 1990s expansion, and slow recoveries that occurred in the last three expansions. This is one of the primary reasons the last three expansions have been labeled "jobless" recoveries. I explained the reasons for this development of "jobless recoveries" in two posts, located here and here. NDD offered a rebuttal here.

Taking a closer look at the early 1990s expansion, notice the initial unemployment claims remained elevated for about a year and a half after the recession ended.

The same is true for the early 2000s recovery -- initial unemployment claims remained high for about a year and a half after the recession ended.

Notice that with this recovery, we are experiencing the same developments.
In short, it appears that while concerning, initial unemployment claims are behaving much as they have in the last two recoveries. This leads to a question regarding the definition of recovery -- that is, can you have a recovery without a drop in initial unemployment claims below a level of say, 400,000?
Yesterday's Market

Yesterday, prices gapped higher at the open (a) and then formed two consolidation patterns for the rest of the day; a triangle in the AM (b) and a rectangle in the PM (c). Also note the MACD (d) which jumped on the gap higher but then moved lower for the rest of the trading day. This is a standard pattern for a consolidation day.

On the daily chart, notice that prices moved through key resistance yesterday.

The Treasury market was a mirror image of the equity market. Prices gapped lower at the open (a), and then rose a bit during the AM. However, as soon as prices hit the 10 and 20 day EMA they started to move lower (c), and did so for the rest of the day. Also notice the MACD (d) was rising for most of the day.

Treasury prices continue lower (a). Also note the EMA picture; the shorter are below the longer, all EMAs are moving lower and prices are below the EMAs (b).
Notice that equities are rising and bonds are falling. This is indicative of a bull market, as money leaves the bond market (which is considered safer) and moves into equities (which is considered riskier).

While the dollar has recently enjoyed a strong rally (a), notice it has hit resistance at the 200 day EMA (b).
Wednesday, December 1, 2010
Mini-May? LIBOR is awakening
- by New Deal democrat
In the past I identified 7 harbingers of the sudden downdraft in the economy that took place over the late spring and summer. With the renewed Euro crisis, other commentators, notably Prof. James Hamilton of Econbrowswer have picked up on the resemblences of the current situation to then (and with Calculated Risk reposting Hamilton's work, you should expect that the resemblences are at this point becoming widely known).
A few weeks ago, I updated the 7 harbingers and concluded they were not suggeting another downdraft at that point. There has been at least one important change, so let's update again.
Harbingers which have turned down:
Shanghai stock index - after a 10% crash in 2 days this market has moved sideways. In April-May it plummeted about twice as much.
Oil prices at 4% of GDP - Oil came very close to $90 again at the beginning of November but already backed off. The duration of the upward move was shorter, and unlike April, there were no intraday moves over $90. Here's a graph:

Libor index rising - this is probably the most telling harbinger of all.
In the past I identified 7 harbingers of the sudden downdraft in the economy that took place over the late spring and summer. With the renewed Euro crisis, other commentators, notably Prof. James Hamilton of Econbrowswer have picked up on the resemblences of the current situation to then (and with Calculated Risk reposting Hamilton's work, you should expect that the resemblences are at this point becoming widely known).
A few weeks ago, I updated the 7 harbingers and concluded they were not suggeting another downdraft at that point. There has been at least one important change, so let's update again.
Harbingers which have turned down:
Shanghai stock index - after a 10% crash in 2 days this market has moved sideways. In April-May it plummeted about twice as much.
Oil prices at 4% of GDP - Oil came very close to $90 again at the beginning of November but already backed off. The duration of the upward move was shorter, and unlike April, there were no intraday moves over $90. Here's a graph:
Libor index rising - this is probably the most telling harbinger of all.
Here's what I said a few weeks ago: "Not only is it still asleep, it has actually declined in the last couple of weeks. There is ZERO anticipation of banking stress evident."
This has changed. LIBOR is awakening from its slumber:

While the percentage move is small at this point, fear is again being introduced into the banking system. Since the European monetary and political leaders appear hapless at this point, unless there is a sudden introduction of shrewdness, I would expect LIBOR to continue to rise. This is the only way I see that the Euro crisis affects the US economy at this point.
Harbingers that have not confirmed a slowdown:
Bond yields correlation with stock prices - This one is a close call. For the last two months, these have both moved up, but on a daily basis these continue to move as mirror images and not in tandem, indicating no fear of a deflationary pulse:

Real M1 and M2 money supply stagnant or shrinking - to the contrary, both continued to grow in November
Price growth exceeded wage growth - Unlike springtime, wage growth now, albeit poor as measured by median compensation, is still running ahead of inflation. Measured by personal income, it is well ahead of inflation.
Decline in housing permits and purchase mortgage applications - purchase mortgage applications are trending sideways and permits are due out tomorrow. They are also expected to trend sideways.
One more thing: The more I have thought about it since summer, the more I believe the BP oil catastrophe in the Gulf of Mexico had an outsized effect on US consumer and employer psychology. Day after day, live video from the bottom of the Gulf showed an ongoing cataclysm, with US authorities looking helpless and ineffectual. G*d willing, we will not see any similar disastrous event unfold now.
In Conclusion, three of our harbingers show increased risk. Of these, the Shanghai index shows only half of the decline as in spring, and Oil did not go as high, or stay there as long, as in April.
The other 4 harbingers do not show increased stress, in fact they are positive for the economy. Also, there is no focusing disaster to trigger the response of Pavlovian fear of another September 2008 style meltdown that I believe was instrumental in the summer slowdown.
My view at this point: it's Mini-May.
While the percentage move is small at this point, fear is again being introduced into the banking system. Since the European monetary and political leaders appear hapless at this point, unless there is a sudden introduction of shrewdness, I would expect LIBOR to continue to rise. This is the only way I see that the Euro crisis affects the US economy at this point.
Harbingers that have not confirmed a slowdown:
Bond yields correlation with stock prices - This one is a close call. For the last two months, these have both moved up, but on a daily basis these continue to move as mirror images and not in tandem, indicating no fear of a deflationary pulse:
Real M1 and M2 money supply stagnant or shrinking - to the contrary, both continued to grow in November
Price growth exceeded wage growth - Unlike springtime, wage growth now, albeit poor as measured by median compensation, is still running ahead of inflation. Measured by personal income, it is well ahead of inflation.
Decline in housing permits and purchase mortgage applications - purchase mortgage applications are trending sideways and permits are due out tomorrow. They are also expected to trend sideways.
One more thing: The more I have thought about it since summer, the more I believe the BP oil catastrophe in the Gulf of Mexico had an outsized effect on US consumer and employer psychology. Day after day, live video from the bottom of the Gulf showed an ongoing cataclysm, with US authorities looking helpless and ineffectual. G*d willing, we will not see any similar disastrous event unfold now.
In Conclusion, three of our harbingers show increased risk. Of these, the Shanghai index shows only half of the decline as in spring, and Oil did not go as high, or stay there as long, as in April.
The other 4 harbingers do not show increased stress, in fact they are positive for the economy. Also, there is no focusing disaster to trigger the response of Pavlovian fear of another September 2008 style meltdown that I believe was instrumental in the summer slowdown.
My view at this point: it's Mini-May.
On the Deficit Commission
SilverOz here.
The Deficit Commission released it's report today and I for one like most of it. Obviously, any cutting of the deficit and reigning in the growth of federal debt is not going to please everyone and there are several things in this report that I would do differently, but then I am not on the Commission. For this post though, I would like to concentrate on the tax changes recommended (specifically the "illustrative proposal").
The Commission proposes essentially ending all tax expenditures (what we know as deductions, credits, and subsidies) and then using the bulk of that savings to consolidate the tax code into three brackets and lower overall rates. What they don't tell us is where each of these brackets begins and ends (at least not where I could find in the report), which while interesting, doesn't impact the discussion since they do provide some breakdown of the impact on various income quintiles. Essentially what the commission is doing is making the effective tax rates the actual tax rates, which will make the code more fair at any given income point (but depending on ones opinion, not necessarily fair across different incomes (ie rich and poor)). Under the current code, two people making the exact same income living in the same city (and even neighborhood) can end up paying widely different amounts in taxes depending on all the various deductions and credits. And while these changes may not be good news for accountants, the simplification of the tax code would save money and time in its own right.
Under the Commission's illustrative proposal, they would eliminate all tax expenditures except for the earned income tax credit (EITC) and child tax credit, change the mortgage interest deduction into a non-refundable credit capped at a $500,000 mortgage, eliminate the tax-exempt status of new muni bonds, and tax all cap gains and dividends as ordinary income (among other things). These changes would then allow for brackets of 12%, 22%, and 28% (all with a standard deduction). The lower brackets would actually increase revenue generated (somewhat) by not utilizing all of the savings from the elimination of tax expenditures for the lower brackets, which allows some to be used to offset the deficit (ie the proposal does raise some taxes somewhere between $80-180 billion).
The change in tax liability by quintile goes up for each, but is definitely skewed towards the highest earners, with the top quintile losing about 3.7% in after tax income (the 3 middle quintiles are around a 1.5% loss and the bottom quintile a .4% loss), but with the top 1% seeing a loss of almost 8% and top .1% seeing a loss of almost 12% (so the tax code retains its progressive nature). What this means is that while everyone is going to see a tax hike, the biggest hikes in terms of percentage of income are skewed toward the wealthiest of Americans as opposed to the middle class.
Finally, I want to comment on the proposed elimination of the mortgage interest tax deduction, as that is an issue that both the left and right (well, the homeowning left and right) seem to get riled up about (full disclosure: I am a homeowner who takes advantage of the deduction). First, it is one of the biggest tax expenditures in the tax code (approximately $100 billion/year) and thus has to be addressed under any real reform. Second, the deduction rewards bad financial behavior, as it rewards those who either a) put down less than 20%, b) buy more house than they should afford (remember the housing bubble), or c) those with bad credit (who get higher interest rates). Also, the deduction is geographically skewed, as more of it's benefits are going to go to say the coasts and other high value areas over the midwest. Finally, the deduction is really nothing more than a reward for taking on debt, something that in light of the recent recession maybe we shouldn't be encouraging anymore (it doesn't reward home ownership, as the cash buyer gets nothing out of it except a higher price to buy at).
In conclusion, I actually like the bulk of the Commission's report and would love to see a bipartisan approach (like this one) on the deficit/debt issue. As a realist however, I know that this report has zero chance of passing and real efforts to reduce our deficit/debt will only come when forced (see Greece).
U.S. Economic Status, Part III: Investment

Let's start with the macro picture of investment, which has been steadily increasing for the last five quarters.

Private non-residential investment has increased the last three quarters, indicating that business is investing in some real estate development.

However, it's the equipment and software investment that is the real reason for the increase. Notice the size of the quarter to quarter increases for the last three quarters.
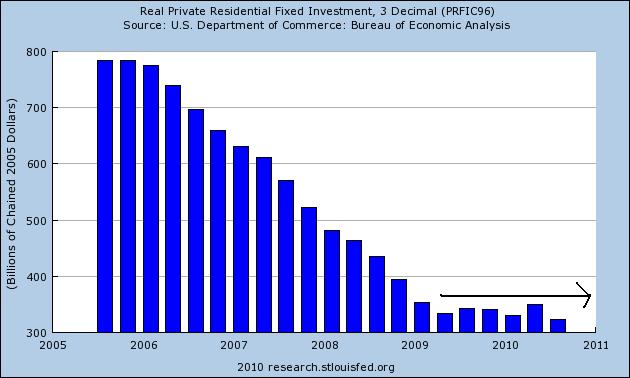
Residential investment is still low, and will probably be that way for some time.

Inventories are being restocked; this overall number has been increasing solidly since the end of 2009.

However, the inventory to sales ratio is about halfway between 1.25 and 1.30, which is about halfway between the high and the low from the last expansion. Also note this number has been decreasing since the early 1990s. So, for inventories to continue their contribution to the expansion, we need to see sales increase
Subscribe to:
Posts (Atom)