Take a deep breath. The November jobs report was either an outlier, or at least at the low end of the expected range of error in the trend. That's probably why the stock market shrugged it off on Friday. The odds are very good that it will be revised significantly higher in the next two months. Regardless, since the source of the problem was how to deal with seasonal retail hiring, the best view is to average the October and November reports together. That means even without upward revisions the economy added ~105,000 jobs a month in the last two months - and it is likely to look better within 60 days.
First of all, let's put this in perspective. Even though Friday's jobs report felt like a kick in the gut, at this time last year we were dealing with relentless job losses. November 2009 job losses had just preliminarily been reported as -11,000, and that was over 100,000 better than the next least-worst report. By contrast, here are the monthly jobs numbers (in thousands), excluding census, for 2010:
| Month | Job gains |
|---|---|
| Jan | +5 |
| Feb | +23 |
| Mar | +160 |
| Apr | +147 |
| May | +21 |
| Jun | +50 |
| Jul | +77 |
| Aug | +113 |
| Sep | +53 |
| Oct | +172(p) |
| Nov | +39(p) |
Every single 2010 jobs number has been positive. No, it's not enough to overcome population growth, which would require about 150,000 a month. Nor is it enough to really begin undoing the job losses of the Great Recession, which would probably require at least 300,000 a month. But excepting the summer slowdown, we have been moving in the right direction for a long time.
Secondly, we have been here before. Here is something Bonddad wrote after September 2009 had just been reported as showing -263,000 jobs lost, another "feel like I've been kicked in the gut" report:
this is a clear step in the wrong direction. Considering the rate of job losses at the beginning of the year (600,000+/month) expecting an immaculate recovery is highly unrealistic. However, the bleeding has to stop at some point. So by the end of this year we have to be far lower than today's number for a recovery to be viable. Consumers cannot continue to hear news like this and expect to have a positive attitude about the economy. It's that simple.Two months later, that had been revised to -139,000, and November would ultimately be revised to +4,000, the first positive jobs report after the bottom of the Great Recession.
Keep that thought in mind and consider the following: here is the change between initial and final jobs report for each month so far this year, with the net change (including census jobs, which have no impact on the result):
| Month | Initial | Final | net change |
|---|---|---|---|
| Jan | -20 | +14 | +34 |
| Feb | -36 | +39 | +75 |
| Mar | +162 | +208 | +46 |
| Apr | +250 | +313 | +63 |
| May | +431 | +432 | +1 |
| Jun | -125 | -175 | -50 |
| Jul | -131 | -66 | +75 |
| Aug | -54 | -1 | +53 |
| Sep | -95 | -24 | +71 |
| Oct | +151 | +172(p) | +21(p) |
| Nov | +39 |
(p)=preliminary revision
Every single initial jobs report in 2010 except one has been revised higher. The median final revision of the Jan-Sep initial reports has been +53,000. All but two of the nine that have been finally revised have increased by at least +46,000. A revision of +53,000 to November would give us +92,000. Even if October is not revised any higher, the average of the two months would be +132,000, the best showing since March-April. If October were also revised up +53,000 from its initial report, that would be +204,000 for a two month average of +148,000 and a three month average of +136,000. In other words, just normal revisions in line with those previously this year would put us very close to the point where we are keeping up with population growth -- but we won't know that for sure for 2 more months.
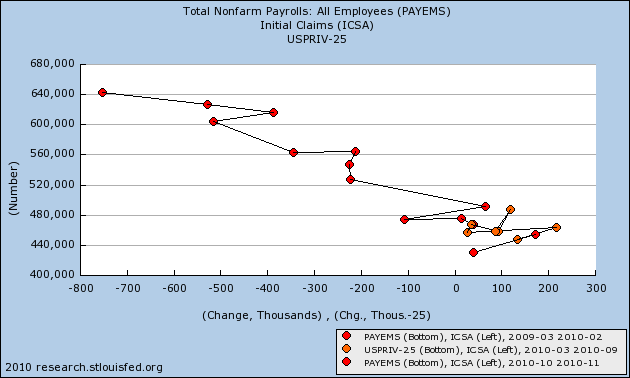
And it is clear that, if November's report wasn't an outlier, than it was at the very low end of the range of error. Here is the update of the scatter graph of Initial Jobless Claims vs. Nonfarm Payrolls since the March 2009 high in claims:

It is pretty clear that the initial November report comes in at the weakest point of the overall trend range.
Third, we know the source of the shortfall in the November report: retail hiring. Every month the BLS includes spreadsheets breaking out the data in their report. Schedule B breaks out the establishment report by type of job. Here is a screenshot of that portion of the spreadsheet dealing with service jobs:

Look at the lines entitled "retail trade" and "other services." Had both of these been at the same levels as October, that would have added +80,000 jobs to the report! Further, compare November with the last two months, and with November last year. The monthly change in both series is significantly lower, retail dramatically so, than even last year when the economy was losing jobs.
So let's break out "retail sales" and "other services" (the two areas that were responsible for the big change between October and November) and take a closer look:
Here is the breakdown of the ultimate Seasonally Adjusted numbers, and m/m change:
First, here is "Other services:"
| Month | Jobs | month/month change |
|---|---|---|
| Jan | 5317 | +3 |
| Feb | 5310 | -7 |
| Mar | 5321 | +11 |
| Apr | 5333 | +12 |
| May | 5337 | +4 |
| Jun | 5330 | -7 |
| Jul | 5352 | +22 |
| Aug | 5363 | +11 |
| Sep | 5410 | +17 |
| Oct | 5402(p) | +30(p) |
| Nov | 4319(p) | -8 (p) |
The median month over month gain for Jan-Sep was +11. If Oct and Nov simply followed that, (i.e., +11 and +11), then Oct overestimated by +19, but Nov's ultimate number is on the mark.
Now, here is "Retail trade:"
| Month | Jobs | month/month change |
|---|---|---|
| Jan | 14409.1 | +49.1 |
| Feb | 14416.2 | +7.1 |
| Mar | 14438.9 | +22.7 |
| Apr | 14453.3 | +14.4 |
| May | 14447.5 | -5.8 |
| Jun | 14431.3 | +16.2 |
| Jul | 14442.4 | +11.2 |
| Aug | 14448.8 | +6.4 |
| Sep | 1444,9 | -3.9 |
| Oct | 14457.9(p) | +13.0(p) |
| Nov | 14429.8(p) | -28.1(p) |
The median month over month gain in retail jobs for Jan-Sep was +7.1 If October and November simply added +7.1 each month, then October is too high by ~6, but November is WAY off. November is too low by ~30!
Another way of looking at this is that, according to the BLS, in November we gave back almost every single retail job we added since February. Further, the last time we gave back 30k or more jobs in one month was in October 2009. Is there anybody who thinks that really happened?
Just to check how big (or not) a role revisions to the "retail trade" number was in the overall revisions, I specifically checked the initial vs. final revised number for that item. Here is the result:
| Month | Initial | Final | net change |
|---|---|---|---|
| Jan | 42.1 | 49.1 | +7.0 |
| Feb | -0.4 | +7.1 | +7.5 |
| Mar | 14.9 | 22.7 | +7.8 |
| Apr | 12.4 | 14.4 | +2.0 |
| May | -6.6 | -5.8 | +0.8 |
| Jun | -6.6 | -16.2 | -10.2 |
| Jul | 6.7 | 11.2 | +4.5 |
| Aug | -4.9 | +6.4 | +11.3 |
| Sep | 5.7 | -3.9 | -9.6 |
| Oct | 27.9 | 13.0 | -14.9(p) |
The median change for the "retail trade" series in the Jan-Sep 2010 revisions is only +4.5 thousand, meaning that if the November initial report missed big on retail positions, while not likely it is at least possible that in addition to a significant upward revision on the order of +50,000 for the other items in the initial November report, there could also be a big positive retail jobs revision .
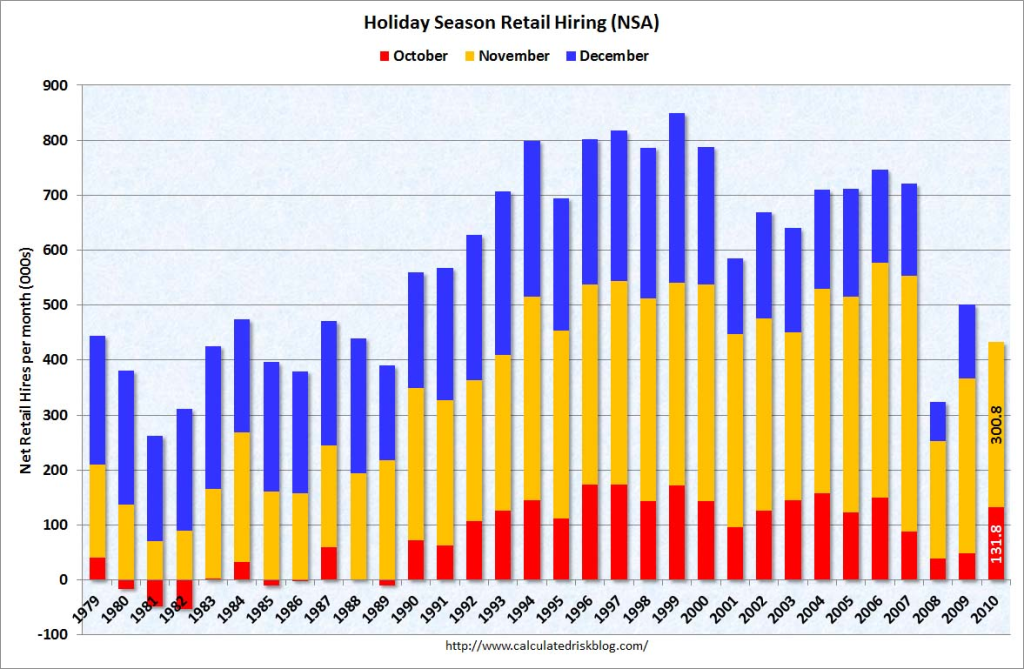
Fourth, it is adjusting for seasonal retail hiring that is the problem. Retailers hire a lot of temporary help for the holiday season. It is a known factor and so is automatically seasonally adjusted. But the adjustment can create outsized effects. In October, the BLS "expected" employers to hire about 118,800 retail employees. In fact they hired 131,800, so the Seasonally Adjusted number was +13,000. In November, the BLS "expected" employers to hire +328,900 retail employees, but they actually hired +300,800, so the inital Seasonally Adjusted number reported on Friday was -28,100.
This is the logic behind the following graph by Calculated Risk, showing non-seasonally adjusted October through December retail hiring for the past 30 years:

Contrast this with, for example, May, when the BLS "expects" employers to add 101.900 "retail trade" jobs, only about 1/3 of November's adjustment.
In short, relatively minor changes in employment plans at this time of year, because of seasonal adjustments, can have outsized effects. As a result, it is probably best to average October and November's reports, as I have done above, to deal with these effects.
Finally, let's bear in mind that both ADP and TrimTabs called for job gains of between 90,000 and 120,000 in November, and both have been consistently understating the BLS reports this year. A revision more in line with those reports would make sense.
In that regard, I have been favored by Matt Trivisonno with a YoY withholding tax graph from his Daily Jobs Update site, current through last week, which adjusts for the "making work pay" credit of the ARRA. It has been relentlessly improving:

This graph has accurately tracked YoY aggregate hours worked in the past ten years, and is currently showing the same YoY% improvement it did at the end of 2004 -- when the economy was consistently adding 200,000 jobs a month.
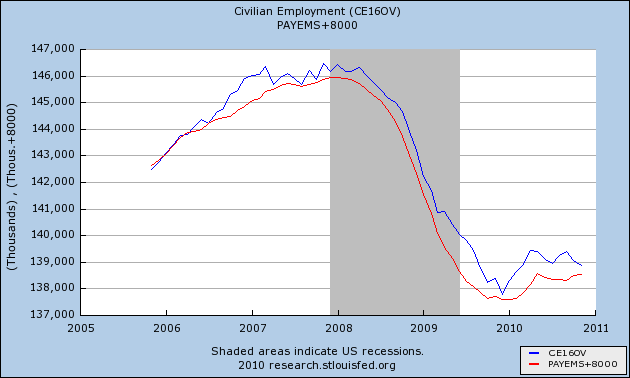
Two caveats: On the other hand, a comparison of the Household Report and the Establishment Report, including Friday's numbers, shows that both have leveled off since the census began its layoffs in May. Furthermore, it cannot be denied that the Household Report has shown actual declines in the last two months, which were not affected by the census at all.

In addition to that very significant caution, bear in mind that the BLS has already told us that they are going to reduce the total jobs count for the 12 months between March 2009 and March 2010 by an average of 30,000 a month. This is very much a wild card. On the one hand, the September 2009 report mentioned at the outset of this post, after having been increased to -113,000, was knocked back down to -225,000 by the yearly adjustment announced this past February. On the other hand, the November 2009 report - the one and only positive report - was actually increased by 64,000 jobs in those yearly revisions. The BLS has historically underestimated job losses during recessions, and underestimated job gains in the first part of a recovery, so it is about equally possible that the revisions which will be announced in February 2011 will go either way.
Bottom line: it is likely, but not certain, that the November payrolls report will be revised significantly higher, and that we continue to move in the right direction. The best approach is to average the October and November reports for the truer trend, which even now is +105,000 each month.