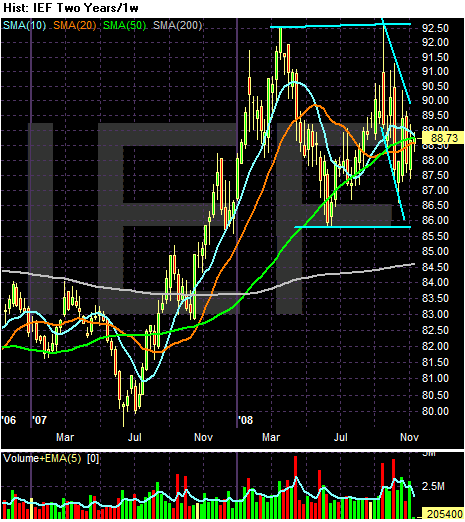
The 2 year chart in weekly increments gives us a great overview of where the market is now. In July of 2007 the beginnings of the financial meltdown started a 9 month rally. That ended in March of this year. Since then the market has been trading sideways, roughly between 86 and 92.5.
A trader could argue the market formed a double top -- which it clearly has. However, what would lead the market to drop from here? The CRB index tells us we're nowhere near inflationary pressures anymore. And there is no sign the Federal Reserve is anywhere near a rate increase. There is concern about supply. With the government deficit increasing to mammoth proportions the Treasury will be issuing a ton of new debt. However, is it enough to send prices through the 86 level?

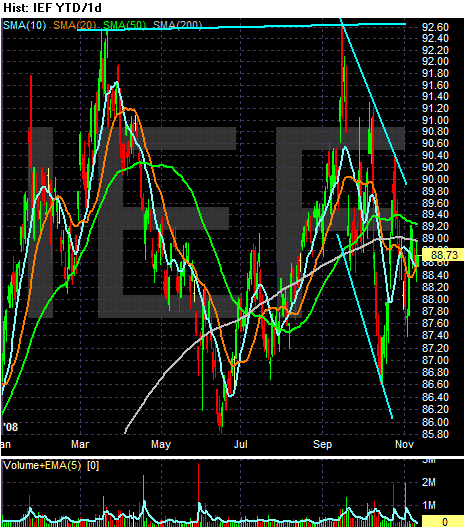
The yearly chart gives us a better view of the sideways trading range the market is going through right now. Most importantly, notice prices and the SMAs are (again) bunched up, indicating a lack of firm conviction for any direction right now.