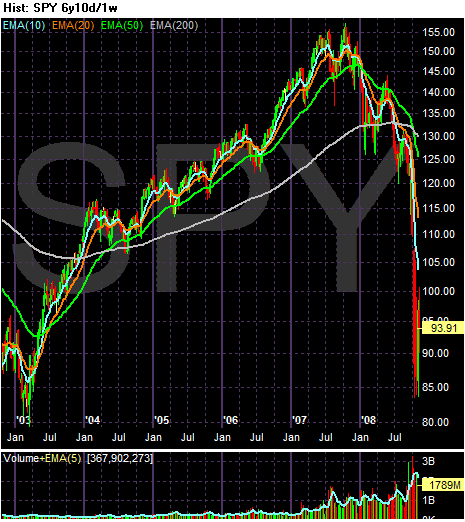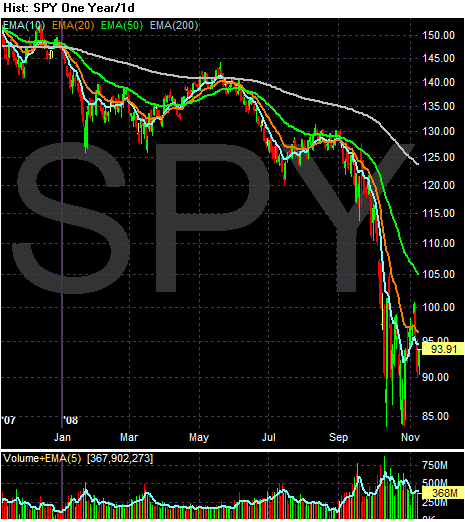
Above is a 7 year chart. It shows the last last rally completely. Notice the following:
-- About 87% of the increase in value (85 to 155) is now gone with the market trading at 93.91. In other words, the rally has been effectively wiped off the books.
-- The market formed a double top in 2007
-- The market has clearly broken all upward trend lines.

Above is a 1-year chart. The most important aspect of this chart is the severity of the sell-off over the last 2 months. That's a big drop.

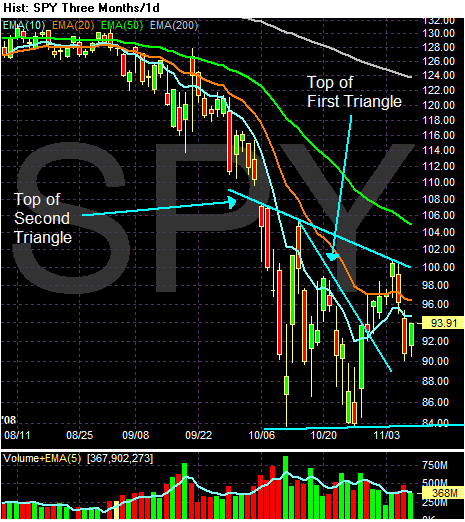
On the daily chart notice the following:
-- The shorter SMAs are moving into a more neutral position. The 10 day SMA actually increased recently and the 20 day SMAs degree of downward movement is decreasing.
-- Prices have fluctuated around the 10 and 20 day SMA for the last week or so.
-- Prices are still clearly within a range
-- A triangle pattern clearly exists
Now, let's consider the macro economic environment right now. We have a new president. The market is waiting to see what he will do. We've had coordinated action from other countries to stem the tide of the credit crunch. There is talk of a second fiscal stimulus bill. In other words the people who can take action are doing so. Also remember the employment is typically a lagging. That means that while Friday's employment report was terrible it could be signaling the beginning of the end to he contraction.