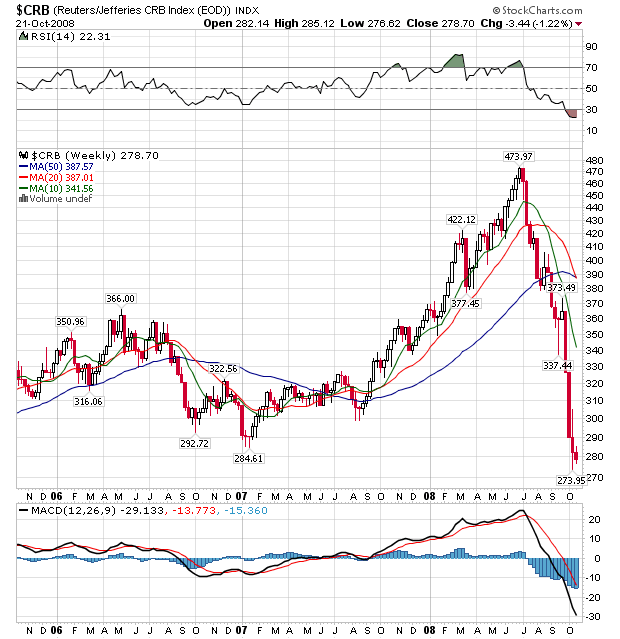
Commodity prices are now at or near their lowest levels in over three years. Also note the following:
-- Prices are below all the SMAs
-- the 20 day SMA is about to move through the 50 day SMA
-- All the SMAs are now moving lower
BUT
Note the CRB is very oversold right now.
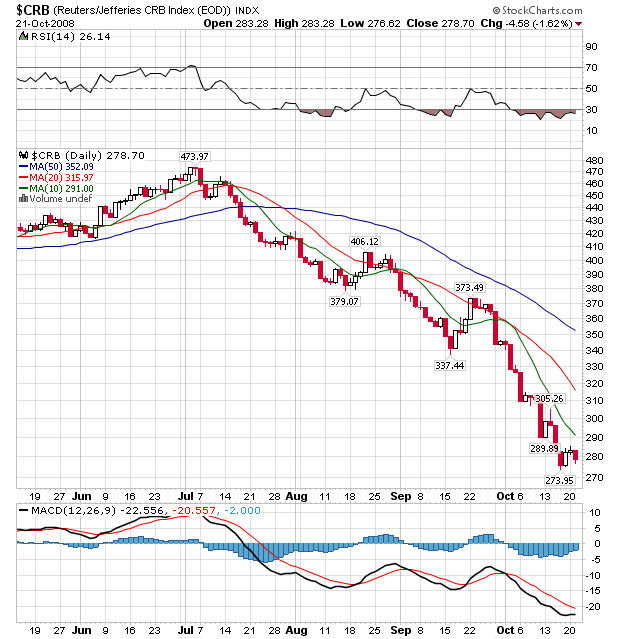
On the daily chart, notice the following:
-- Prices are below all the SMAs
-- All the SMAs are moving lower
-- The shorter SMAs are below the longer SMAs
-- Prices have been dropping for three months
This chart looks a great deal like the dollar chart from the last few years.
Bottom line: this is now a very bearish index.