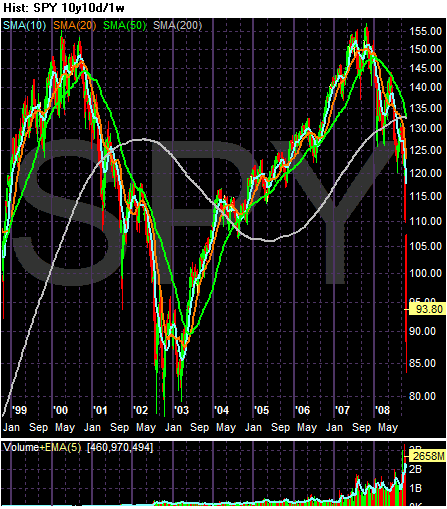
Note the SPYs have formed a multi-year double top. The first top occurred in 2000 and the second top occurred last year. Prices have obviously fallen since the 2007 top.
Consider that from 2003-2007 prices ran from a low of around 80 in 2003 to 155 last year. Prices are now at 93.8. In other words, most of the 2003-2007 rally is now gone. Yet corporate profits have increased since 2003, meaning overall valuations are cheap by historical standards.

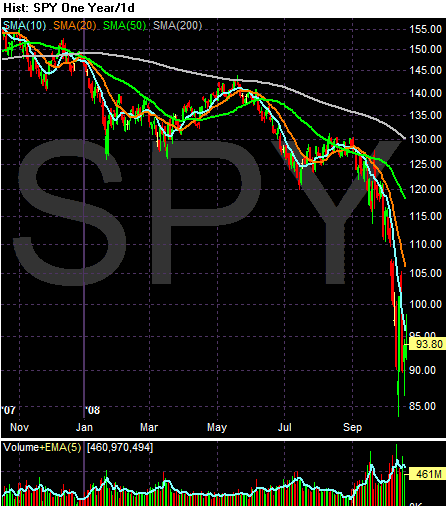
On the year long chart, simply notice the market has been dropping for the last year. That's a pretty long time in market history. Another way to say this is the market has been correcting for a long enough time to shake out a lot of speculative players. In addition, note the volume increase in September and October of this year. That could be a selling climax.

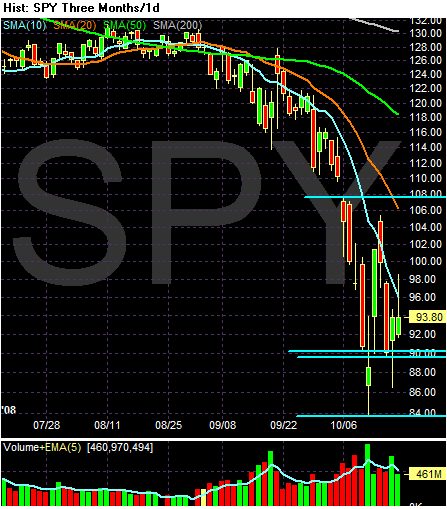
On the three month chart, notice the following:
-- Prices are below all the SMAs
-- All the SMAs are moving lower
-- The shorter SMAs are below the longer SMAs
In other words, this is a classic bear market chart. However, also note that prices are moving in a wide consolidation range right now. The most extreme reading of this range would be 84-108. However, I think the real bottom would be around 90, closing the range to 18 points. I'm thinking the market is going to consolidate in this range barring another unforeseen random economic event.