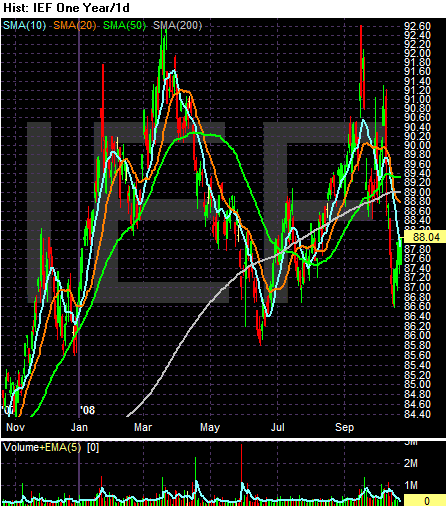
On the yearly chart, notice we have a possible double top forming. The first occurred at the beginning of the second quarter of 2008 and the second occurred at the end of the third quarter of 2008.
Also note the market has had the following moves. A rally that ended in late March 2008 which was caused by the credit crisis. A sell-off that was caused by a stock market rally which ended in late June 2008. A rally that lasted from late June to late September that was caused by a credit crisis which lasted from late June to late September and finally a sell-off that is caused by the mammoth amount of debt the US government is issuing for the bail-out. On that note, let's go to the three month chart:

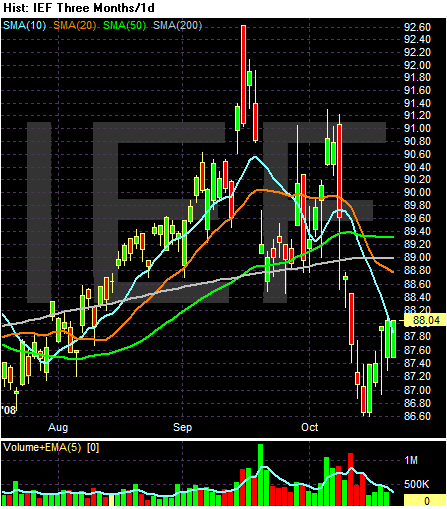
On the daily chart, note the following:
-- The short term SMAs are bearish. Both the 10 and 20 day SMA are moving lower and have moved below the 50 day SMA
-- The 200 day SMA is still rising, indicating the long-term trend is up.
-- The 50 day SMA has a slight downward bias right now. This will probably move lower in the next few weeks as prices are below this number
-- Prices have been moving around the 200 day SMA with little indication of what long-term trend they want to take.
Bottom line: there are a lot of contradicting signals on this chart.